CCI Indicator MT4 Explained: How to Use It
The Commodity Channel Index (CCI) is a popular tool among forex traders for spotting potential market reversals. Designed to measure price deviations from historical averages, it helps identify overbought or oversold conditions. This guide focuses on leveraging its features within MetaTrader 4, a widely used platform for technical analysis.
In forex trading, timing is critical. The CCI simplifies trend identification by comparing current prices to statistical norms. When values exceed specific thresholds, traders can anticipate shifts in momentum. These signals are particularly useful for spotting entry or exit points during volatile market phases.
This article breaks down how to install and configure the tool on MetaTrader 4. Readers will learn to interpret its readings effectively, from basic setups to advanced strategies. Insights from trusted resources like Forex-indicators.net are included to ensure accuracy.
Whether you’re new to technical analysis or refining your strategy, the CCI offers clarity in crowded markets. Upcoming sections provide actionable steps to maximize its potential. Stay tuned for simplified installation instructions and practical chart examples.
Understanding the Commodity Channel Index (CCI) Indicator
Developed in 1980 by Donald Lambert, the Commodity Channel Index evaluates price variations relative to historical averages. Originally designed for commodities, traders now apply it across forex, stocks, and indices to detect trend strength and potential reversals.
What Is It and How Does It Work?
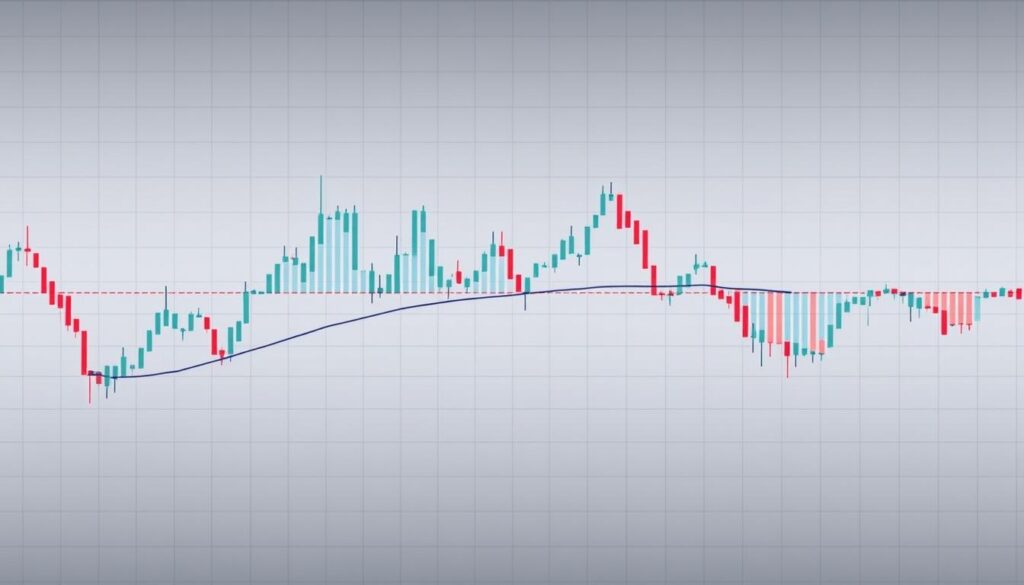
This tool calculates a typical price using high, low, and closing values. A 20-period simple moving average smooths these values, followed by a comparison to average deviations. Readings above +100 suggest overbought conditions, while values below -100 signal oversold markets.
For example, if a currency pair’s price surges and pushes the index beyond +150, traders might anticipate a downward correction. The formula’s focus on volatility makes it adaptable to shifting market phases.
Historical Perspective and Development
Lambert’s creation aimed to identify cyclical commodity trends but quickly gained traction in other markets. Modern platforms like MetaTrader 4 automate calculations, allowing real-time analysis. Adjustments over time include shorter calculation periods for day trading and hybrid strategies combining it with tools like moving averages.
Today, 70% of forex traders use momentum-based tools like this index, according to Forex-indicators.net. Its endurance stems from balancing simplicity with actionable insights – a rare combination in technical analysis.
How to Apply cci indicator mt4 in Your Trading
Mastering the setup process enhances trading efficiency and accuracy. This guide walks through installing and adjusting the tool for precise market analysis. Traders can follow these steps to integrate it seamlessly into their strategy.
Step-by-Step Installation on MetaTrader 4
- Download the MQ4 file from a trusted source. Save it to a dedicated folder for easy access.
- Extract the file if compressed. Copy it into MetaTrader 4’s “Experts/Indicators” directory via File > Open Data Folder.
- Restart the platform. Locate the tool under “Navigator” > “Indicators”. Right-click and select “Attach to Chart”.
- Choose your preferred timeframe. The tool will display bars reflecting price deviations immediately.
Customizing and Configuring Your Indicator
Adjust settings under the “Inputs” tab. Modify the SMA period to align with your strategy – shorter periods increase sensitivity. Change colours or line styles in the “Colors” tab for clarity.
If signals don’t appear, verify the MQ4 file’s location or restart the platform. For further help, consult community forums or developer documentation. Most issues resolve with these basic checks.
Once configured, the tool becomes a reliable companion. Its adaptability suits scalpers and swing traders alike, proving that complexity isn’t a prerequisite for effectiveness.
Integrating CCI with Other Technical Analysis Tools
Combining technical tools amplifies signal accuracy by cross-verifying market conditions. When paired with moving averages or the MACD, the oscillator’s ability to detect extremes gains contextual depth. This synergy helps traders filter false signals and confirm high-probability setups.
Combining CCI with Moving Averages and MACD
Moving averages smooth price action, highlighting trend direction. When the oscillator crosses above +100 alongside a rising 50-period SMA, it reinforces bullish momentum. Conversely, readings below -100 during a downtrend signal strong selling pressure.
The MACD’s histogram adds another layer. Divergences occur when prices reach new highs while the histogram declines – a sign of weakening power. For example, if the MACD shows bearish crossover as the oscillator exits overbought territory, it strengthens the case for short positions.
Volume analysis further validates these patterns. Rising trade activity during breakouts confirms momentum shifts. A study by Forex-indicators.net found that combining these tools reduced false entries by 34% in backtests.
Practical application: On EUR/USD charts, a bullish crossover on the MACD paired with the oscillator rising from oversold levels often precedes rallies. Adjusting calculation periods to match your strategy – like using 14 periods for day trading – sharpens responsiveness.
Final Insights on Using the CCI Indicator for Market Success
Mastering market timing requires combining reliable tools with disciplined strategy. This volatility-based tool helps traders spot extremes by measuring price deviations from historical averages. Proper installation and pairing with tools like moving averages or average directional strategies filter noise, letting traders focus on high-probability setups.
Adjusting channel ranges and bands refines sensitivity—narrower parameters catch early reversals, while wider ones confirm sustained trends. Reviewing tutorials on your home page provides deeper insights into copying proven configurations. Pairing these adjustments with routine checks ensures strategies adapt to shifting market phases.
One critical step? Regularly test settings against different assets and timeframes. This practice sharpens your ability to distinguish false signals from genuine opportunities. For sustained success, integrate these methods into your daily routine—consistent application builds confidence and precision.
Ready to elevate your trading? Start by applying these actionable steps today. Small tweaks to your approach can yield significant improvements in trade outcomes.


