ATR Bands MT5: A Technical Analysis Tool Explained
This guide explores a popular technical analysis tool that helps traders adapt strategies to shifting market conditions. By combining volatility measurements with dynamic price boundaries, this indicator offers a modern approach to identifying trading opportunities.
The system calculates adaptive bands around moving averages using real-time volatility data. Unlike static indicators, these boundaries expand and contract based on market activity. This feature allows traders to set risk parameters that automatically adjust to current price movements.
Market participants use this tool for multiple purposes. It helps identify trend strength while measuring volatility through customizable parameters. The integration of these functions makes it particularly useful for developing entry/exit strategies across different asset classes.
Platform-specific versions like the MT5 indicator provide enhanced charting capabilities. Users can modify settings to match their preferred trading style or market conditions. This flexibility supports both short-term scalpers and position traders seeking clearer price boundaries.
Understanding this analytical approach helps traders incorporate volatility insights into their decision-making process. The methodology represents an evolution in technical analysis, moving beyond traditional fixed-range systems to dynamic market responsiveness.
Understanding ATR Bands MT5
Traders seeking dynamic market analysis tools often turn to systems combining price boundaries with volatility insights. This approach uses adaptive calculations to create responsive trading zones, adjusting automatically to shifting market rhythms.
Defining the ATR and Its Application
Developed by J. Welles Wilder Jr., the average true range measures price movement intensity over chosen periods. It evaluates three elements:
- Current trading session’s high-low difference
- Gap between today’s high and yesterday’s closing price
- Space between today’s low and previous session’s close
This calculation helps quantify market turbulence, forming the foundation for adaptive boundary systems. During most volatile periods, these measurements widen the bands, while calmer markets trigger contraction.
The Role of Moving Averages in the Indicator
Central to this analytical method, moving averages establish baseline price trends. The tool incorporates multiple average types:
- Simple moving averages for balanced trend identification
- Exponential versions prioritizing recent price action
Faster averages produce quicker signals, ideal for short-term strategies. Slower ones filter market noise, benefiting position traders. This flexibility allows customization across various assets and time horizons.
Technical Foundations of ATR and Moving Averages
Market analysis relies on precise mathematical models to interpret price action. Two core components form the backbone of volatility-based systems: range measurements and trend-smoothing techniques.
Exploring Average True Range Fundamentals
The true range calculation identifies maximum price movement across three scenarios:
- Current session’s high-low spread
- Gap between today’s high and yesterday’s close
- Difference between today’s low and prior closing price
This approach captures volatility more accurately than basic range measurements. Traders typically use 14 periods for average true range calculations, though shorter spans increase responsiveness.
Insights into Moving Average Methods
Trend analysis tools employ different averaging techniques:
- Simple moving average: Equal weight to all prices
- Exponential version: Prioritises recent data
- Hull method: Combines weighted averages for reduced lag
The Hull calculation uses midpoint and full-period weighted averages. This hybrid approach maintains smoothness while reacting faster to price shifts than traditional methods.
Key Features and Configurations
Modern trading systems thrive on adaptability. This volatility-based tool offers multiple adjustment points for tailoring strategies to evolving market rhythms. Users gain precise control over boundary placements and calculation methods through intuitive parameter settings.
Configurable ATR Offset and Scaling Factor
The offset feature determines spacing between central trend lines and outer boundaries. Traders expand this gap for wider price corridors during turbulent markets or reduce it for tighter risk control. Scaling multipliers modify volatility sensitivity, allowing adjustment from conservative 1x to aggressive 3x expansions.
Independent period settings govern trend and volatility calculations. Shorter spans increase responsiveness to sudden price shifts. Longer durations smooth out temporary fluctuations, benefiting swing traders analysing broader patterns.
Customizable Settings and Input Types
Price reference options include four data points: session opens, closes, highs, or lows. This flexibility helps align calculations with specific strategy requirements. For instance, using closing prices often suits position traders, while intraday specialists might prefer high-low averages.
Input standardization prevents platform inconsistencies. Clearly defined parameters ensure identical behaviour across different installations. The system automatically validates entries, reducing configuration errors that could distort boundary placements.
Implementing atr bands mt5 in Your Trading Strategy
Effective strategy implementation requires clear rules for capitalizing on volatility-driven opportunities. This approach combines boundary breakouts with adaptive risk management, helping traders navigate shifting market conditions systematically.
Identifying Entry and Exit Points
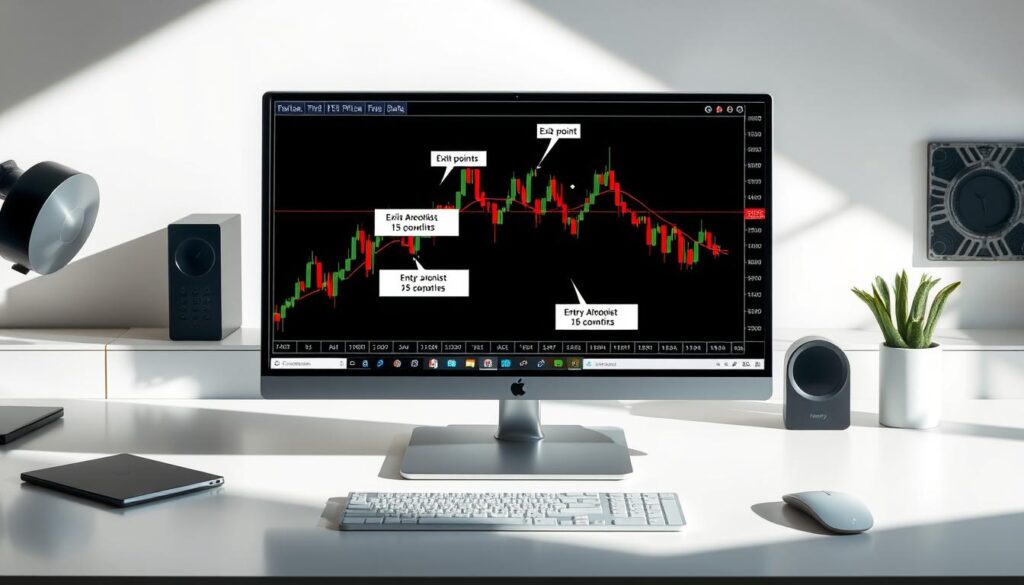
Price movements beyond upper or lower boundaries often signal potential trades. Breakouts above the upper line suggest bullish momentum, while drops below the lower line may indicate bearish trends. These signals gain strength when accompanied by rising volume or alignment with broader market direction.
The central trend line serves as a critical reference for exits. Positions often reach optimal closure when prices revert to this baseline. Traders might scale out partially at intermediate targets while letting remaining positions ride the trend.
Utilizing Stop-Loss and Take-Profit Targets
Volatility-adjusted protection levels automatically adapt to market conditions. Wider stops during turbulent periods prevent premature exits, while tighter ones lock in profits during stable phases. This dynamic approach balances risk exposure with profit potential.
Profit targets frequently use multiples of current volatility measurements. A common technique sets initial objectives at 1.5x the entry-point range, with trailing adjustments as trends develop. Combining these techniques with confirmation tools like momentum oscillators improves decision accuracy.
Enhancing Market Analysis and Trend Identification
Market participants require adaptive tools to navigate evolving price dynamics effectively. Dynamic boundaries derived from volatility measurements offer fresh perspectives on price thresholds and trend sustainability. These adaptive zones replace rigid historical markers with responsive guides that reflect real-time market behaviour.
Establishing Support and Resistance Levels
The system creates evolving support resistance levels through upper and lower boundaries. These adjust automatically based on current volatility, unlike static horizontal markers. When prices approach the lower boundary and rebound, it signals strong support levels reinforced by buyer activity.
Conversely, repeated tests of upper boundaries often reveal resistance levels where selling pressure intensifies. Traders monitor these interactions to gauge potential breakouts or reversals. The dynamic nature of these zones makes them particularly useful in fast-moving markets where fixed reference points become obsolete.
Interpreting Volatility for Better Decisions
Band width changes serve as a visual volatility gauge. Expanding boundaries indicate rising market uncertainty, while contracting ones suggest consolidation. This real-time feedback helps traders adjust position sizes and risk parameters accordingly.
Strong trends typically maintain consistent distance from the central baseline, while choppy markets show frequent boundary touches. Combining these observations with volume data improves decision accuracy. Traders might tighten stop-loss orders during low volatility phases or expand profit targets when boundaries widen sharply.
Practical Application: Setup and Customization
Customising technical tools enhances strategic precision while adapting to individual trading rhythms. Proper configuration ensures alignment between market conditions and personal risk parameters.
Adjusting Indicator Settings in MT5
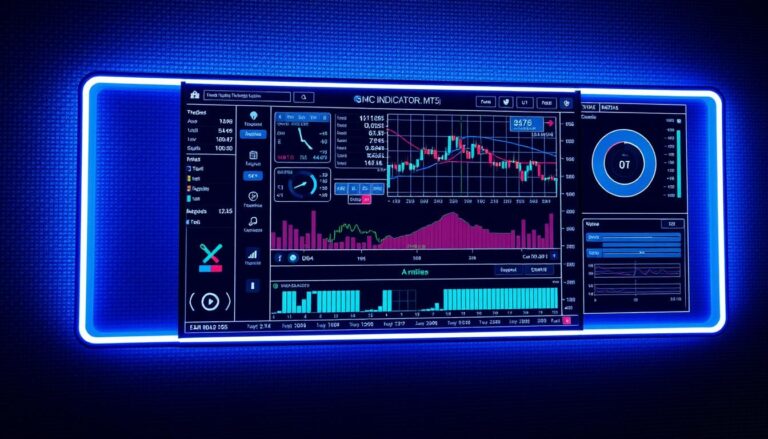
MetaTrader 5 users begin by installing the volatility-based tool through the platform’s technical analysis folder. Three critical adjustments shape its behaviour:
- Timeframe selection: Match chart intervals to strategy goals – shorter spans for scalping, longer ones for swing trading
- Visual customisation: Modify line colours and thickness for clearer trend identification
- Price reference points: Choose between closing prices or weighted averages for calculation inputs
The settings panel allows modification of two core components. Lookback periods control historical data analysis depth, while multiplication factors adjust boundary distances from central trend lines. Traders often test combinations across different assets before finalising configurations.
Advanced users leverage custom blocks to integrate supplementary filters. These might include momentum oscillators or volume-based conditions, creating layered decision frameworks. Such enhancements require understanding how calculation steps interact within the system’s architecture.
Regular reviews of indicator performance ensure settings remain effective as markets evolve. Adjustments to sensitivity levels or time horizons often prove necessary when transitioning between volatile and stable phases.
Final Reflections on the Utility of ATR Bands MT5
Volatility-driven analysis tools continue reshaping modern trading approaches. The ATR Bands MT5 stands out by merging adaptive price boundaries with real-time market rhythms. This indicator transforms static support and resistance concepts into dynamic decision-making frameworks that evolve with each candle.
Traders gain mathematical precision through automated boundary adjustments. These levels remove emotional guesswork while highlighting critical price thresholds. When combined with proper risk protocols, the tool helps distinguish meaningful breakouts from routine market fluctuations.
Entry and exit signals become more strategic through volatility-adjusted calculations. Short-term scalpers and position traders alike benefit from customisable width settings that match various time horizons. This flexibility ensures relevance across currencies, commodities, and indices.
Success demands integrating this indicator into broader analysis. Effective traders pair its signals with volume studies and market structure assessments. Regular parameter reviews maintain alignment with shifting trend dynamics, proving essential for sustained performance.

