MT5 Volume Indicators: A Guide for Forex Traders
Successful forex trading requires more than just watching price charts. It demands a deep understanding of market activity. This guide explores the essential role that MT5 volume indicators play in helping traders make informed decisions.
These analytical tools measure the number of trades executed in a market during a given period. This data reveals the level of participation behind price movements. For market participants, this information is invaluable.
Traders who master this type of analysis gain a significant edge. They can better identify the strength of a trend and spot potential reversals. This knowledge helps in finding optimal entry and exit points for various strategies.
The MetaTrader 5 platform offers several powerful options for this kind of analysis. Each tool caters to different styles, from fast-paced scalping to longer-term swing trading. This flexibility allows every trader to customize their approach.
This comprehensive guide will walk you through the fundamentals. It introduces the most effective tools available and demonstrates practical applications. The goal is to help you develop a more sophisticated understanding of market dynamics and improve your timing.
Understanding Forex Trading Volume
The concept of trading volume serves as a fundamental metric across various financial instruments. In traditional markets, this measurement refers to the total contracts exchanged for a specific asset during a defined period.
Stock markets provide precise volume data since transactions occur on centralized exchanges. However, the foreign exchange market operates differently due to its decentralized nature. Tracking exact transaction quantities across all global platforms proves impossible.
Forex participants instead use tick volume as a practical alternative. This approach counts price changes rather than actual contract numbers. When a currency pair’s price fluctuates 120 times in one hour, the tick volume registers as 120.
Research demonstrates strong correlation between tick data and actual futures volume for major pairs. This makes tick volume a reliable proxy for analyzing market dynamics. Understanding this distinction helps traders interpret data correctly and avoid misconceptions.
The Importance of Volume in Market Analysis
While many traders focus exclusively on price movements, sophisticated analysis incorporates an additional layer of market intelligence. This data serves as a critical confirmation tool, validating the strength and sustainability of price trends. Examining participation levels behind each movement provides essential context.
When price advances occur alongside increasing activity, this pattern suggests strong market conviction. The trend is likely to continue as more participants commit capital in the same direction. This alignment indicates genuine momentum.
Conversely, price movements on declining activity often signal weakening momentum. This divergence warns traders that the current trend may be losing steam. Such patterns frequently precede significant market shifts.
Analysis helps distinguish between genuine breakouts and false signals. Authentic breakouts from consolidation patterns typically feature significant expansion that confirms validity. This prevents traders from entering positions based on misleading signals.
Market reversals frequently announce themselves through specific patterns. Climactic spikes often mark turning points where one side becomes exhausted. Momentum then shifts to the opposing direction.
By incorporating this approach, traders develop a more three-dimensional view of market dynamics. This universal tool enhances decision-making across all timeframes and trading styles. It provides valuable insights whether focusing on intraday movements or longer-term trends.
An Introduction to MT5 Volume Indicators
The foundation of volume analysis begins with understanding the basic tools available on trading platforms. MetaTrader terminals provide a standard feature called “Volumes” that serves as the starting point for many traders.
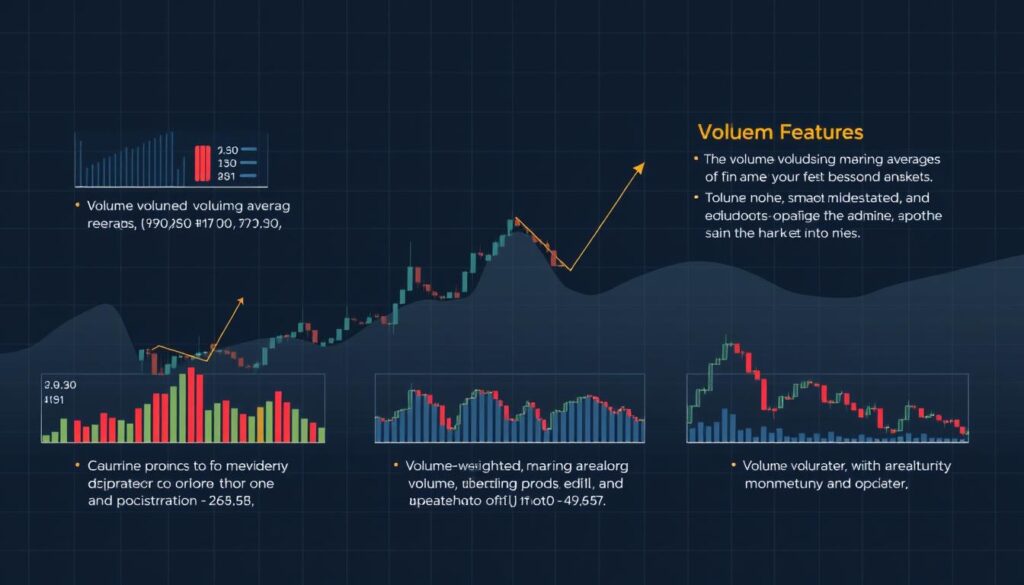
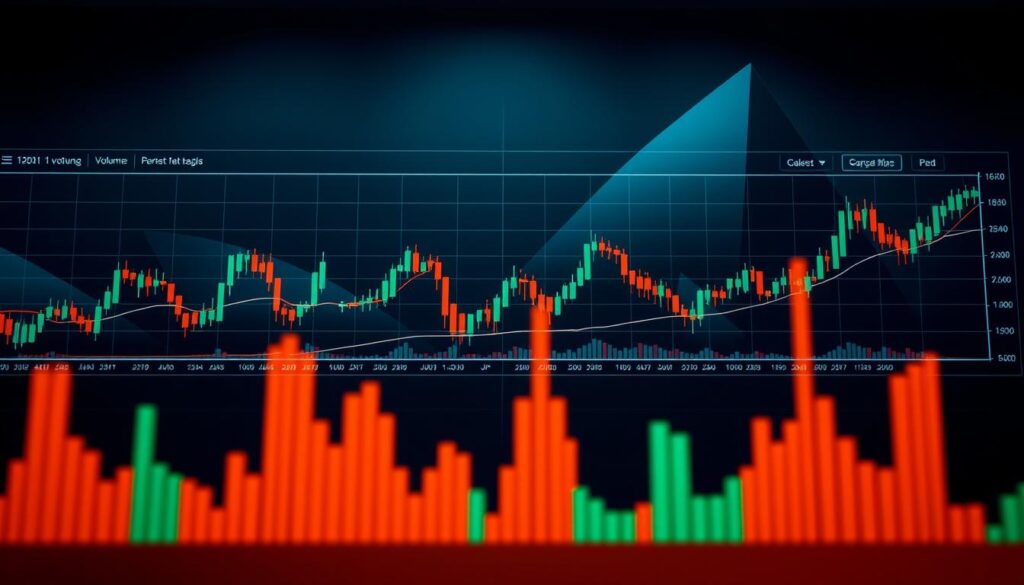
This built-in tool displays tick data directly beneath each price candle. It shows the number of price changes during each period’s formation. Green and red bars indicate increasing or decreasing market activity.
Beyond this basic option, the platform ecosystem offers numerous advanced analytical instruments. These community-developed tools provide more sophisticated interpretation of market patterns. They transform raw data into actionable trading signals.
Different tools cater to various trading styles. Some suit fast-paced scalpers watching minute-by-minute changes. Others help swing traders analyze broader trends across multiple sessions.
The flexibility of the MetaTrader platform allows significant customization. Traders can adjust colors, periods, and calculation methods. This helps align the tools with individual strategy preferences.
Understanding each tool’s capabilities prevents reliance on mismatched instruments. Selecting the right analytical approach enhances decision-making effectiveness. Proper tool selection forms the basis of successful volume-based analysis.
Key Features of Better Volume Indicators
Sophisticated market analysis tools employ color-coded systems to instantly communicate complex trading patterns. These advanced instruments transform raw data into clear visual signals that traders can interpret at a glance.
Dynamic Volume Categorisation and Colour Indicators
This analytical tool automatically classifies market activity into specific categories. Each category receives a distinct color for immediate visual recognition.
Crimson represents buying climax moments with high activity during price rises. Lime green signals strong selling pressure with elevated participation. Gold indicates churn periods with high volatility but unclear direction.
Magenta shows climax churn combining extreme volatility with buy/sell pressure. Dark turquoise marks weak candles with minimal activity. White smoke represents balanced, standard market conditions.
Moving Average Volume for Trend Detection
The tool includes a smoothed line that tracks the average activity over time. This helps identify whether current levels are above or below recent norms.
When this line trends upward, it suggests increasing market participation. This often accompanies strong directional movements. A declining average may signal waning interest in the current trend.
Advanced Customisation Options
Traders can adjust the period for the average line to match their preferred timeframe. Shorter periods provide more responsive signals for active strategies.
The lookback window determines how many previous bars the tool considers. This allows calibration of sensitivity to recent changes versus longer-term patterns. These features ensure the indicator adapts to various trading styles and market conditions.
Deciphering Indicator Signals for Trading
Market analysis becomes more precise when traders can decode the specific messages conveyed by different signal types. These visual cues transform complex data into understandable trading intelligence.
Identifying Climax Signals and Churn
Climax patterns represent extreme market conditions. A buying climax appears as a tall red bar, showing intense buyer activity that often precedes trend exhaustion.
Selling climax signals mirror this pattern with white or lime green bars. They indicate capitulation points where selling pressure peaks.
Churn patterns show high activity with minimal price movement. This suggests institutional repositioning and often warns of impending trend changes.
Interpreting Weak Candles and Volume Balance
Weak candles appear as yellow bars with minimal height. They signal low participation, typically occurring before trend completion.
Volume balance indicators display blue bars during normal conditions. These patterns suggest standard market activity without exceptional events.
Understanding these signal categories helps traders anticipate reversals and time entries more effectively. Each pattern provides unique insights into market dynamics.
Adjusting Indicator Settings for Optimal Results
Parameter adjustment plays a crucial role in maximizing the effectiveness of market analysis instruments. Traders can fine-tune these tools to match their specific strategies and preferences.
Proper configuration ensures signals remain relevant across different market conditions. This customization process transforms generic tools into personalized analytical assets.
Customizing the Moving Average Period
The moving average period setting determines how responsive the tool remains to recent changes. Shorter periods between 10-20 work well for active trading strategies.
Longer periods from 30-50 provide smoother signals suitable for swing trading. Each trader should select the timeframe that aligns with their approach.
Setting the Lookback Window for Accuracy
The lookback window parameter controls how many previous bars the tool considers. This affects signal sensitivity on the price chart.
A shorter window of 10-20 bars creates more reactive classifications. Longer windows of 30-50 bars offer greater stability over time.
This versatile indicator adapts to any trading style through careful parameter selection. The right settings make the analytical indicator more effective for individual needs.
Comparing Standard Volumes with the Better Volume Indicator
Basic volume visualization serves as a starting point, but experienced traders quickly recognize its limitations. The standard volume indicator included with MetaTrader platforms uses a simple color system. Green bars show increased activity compared to the previous bar, while red indicates decreased participation.
This approach provides fundamental information but lacks contextual depth. It treats minor increases the same as major spikes, missing crucial market intelligence. The tool only compares consecutive bars without historical perspective.
Better Volume indicators emerged to address these analytical gaps. They employ sophisticated algorithms that categorize activity into distinct classes. This system instantly communicates whether current participation represents normal fluctuation or exceptional market events.
The advanced tool compares current activity against a configurable historical period. This helps traders distinguish between meaningful volume patterns and random noise. The multi-color classification system provides immediate visual cues about market conditions.
For serious market participants, upgrading to specialized trading tools represents a significant analytical enhancement. The minimal installation effort yields substantial improvements in market interpretation. This explains the widespread adoption of advanced volume analysis within the MT5 community.
Guide to Volume Indicator Customisation on MetaTrader 5
Customizing analytical tools represents a crucial step in adapting them to individual trading approaches. The MetaTrader 5 platform provides extensive settings that allow traders to tailor their analysis precisely. This flexibility ensures each tool matches specific strategy requirements.
Choosing Between Real and Tick Volume
Traders face an important decision between VOLUME_REAL and VOLUME_TICK data types. Real volume shows actual transaction numbers for exchange-traded instruments like futures. This provides the most accurate participation measurement when available.
Tick volume serves as the standard for forex pairs in decentralized markets. It counts price changes rather than actual trades. For major currency pairs, this data correlates well with futures market activity.
Optimizing Timeframes for Enhanced Analysis
Timeframe selection dramatically affects how volume patterns appear on the chart. Scalpers typically use 1-minute to 15-minute charts for precise entry timing. Day traders often prefer 15-minute to 1-hour timeframes.
Longer timeframe analysis helps swing traders identify major trend changes. The same volume pattern can signal different things across various time periods. Multi-timeframe analysis provides confirmation when patterns align.
This MT5 platform maintains consistent display across all chart periods. Traders can quickly compare activity levels from intraday to weekly views. This comprehensive approach enhances decision-making accuracy over time.
Utilizing Volume Data for Entry and Exit Strategies
The art of position management combines technical analysis with market participation data. Traders can significantly improve their timing by incorporating activity levels into their decision-making process.
Effective entry strategies seek alignment between price direction and participation expansion. When prices break resistance levels with elevated activity, this confirms genuine buying interest. Waiting for this confirmation prevents premature entries that lack momentum.
Volume divergence provides powerful signals for counter-trend positions. When price makes new highs but activity fails to confirm, it suggests weakening strength. Climax patterns offer specific opportunities to enter after exhaustion points.
Exit strategies benefit from recognizing distribution patterns. Increased activity on down days within uptrends signals smart money exiting. Traders can adjust trailing stops based on participation levels.
The combination of activity signals with price action creates a complete framework. This approach generates higher-probability decisions than either method alone. Position sizing can also incorporate confirmation strength for optimal risk management.
Essential Tools and Resources for Downloading Indicators
Finding the right analytical tools begins with knowing where to obtain them. The official marketplace within the trading platform serves as the primary source. It offers both free and premium options developed by programmers worldwide.
Traders can access these resources directly through their terminal. They simply navigate to the Market tab or Code Base section. Here, they search for specific analytical tools, read descriptions, and view screenshots before installation.
The Better Volume analytical tool is available as an MQ5 file. Its approximate size is 12.03 KB. Traders can find it on various trading communities and specialized forex websites.
Free download resources provide access to thousands of tools without cost. However, users should always verify the source reputation. Reading user reviews before installing any third-party code is crucial for security.
The installation process is straightforward. Users place the MQ5 or EX5 file into the Indicators folder within the data directory. Then they restart the platform or refresh the Navigator window to activate the new tool.
Many developers offer complete packages with documentation and tutorials. For unique requirements, the Freelance service connects traders with programmers. This option involves costs but delivers custom solutions.
Before deploying any new tool, testing on a demo account is essential. This ensures the tool functions as expected with the current platform build. Proper verification prevents potential issues during live trading.
Integrating Volume Analysis with Trend Patterns
Technical chart formations gain significant credibility when market participation data confirms their validity. This integration creates a powerful synergy between price movements and the underlying market activity.
Classical trend patterns like channels and trendlines become much more reliable when supported by appropriate participation levels. A breakout from a consolidation pattern with expanding activity suggests genuine market conviction.
Healthy uptrends typically show increasing participation as prices advance. This indicates growing market interest and suggests the trend has room to continue. Conversely, declining activity during advances raises sustainability concerns.
Downtrends unfolding on expanding participation demonstrate strong bearish conviction. More traders joining the selling creates momentum that often leads to continuation. Patterns like triangles and wedges gain reliability when breakouts occur with above-average activity.
Head and shoulders formations receive additional confirmation through participation patterns. The left shoulder often forms with high activity, the head with moderate levels, and the right shoulder with declining participation. The neckline break requires expansion for validation.
Support and resistance levels carry greater significance when previous touches occurred with substantial market activity. This indicates many participants have vested interests at these price points.
Participation signals like climaxes and churn provide early warnings at critical pattern junctures. These signals help traders anticipate whether patterns will resolve as expected or potentially fail.
Practical Examples in Forex Trading Using Volume Indicators
Forex practitioners benefit greatly from examining specific scenarios where participation data influences decisions. These real-world illustrations demonstrate how analytical tools translate into actionable strategies.
Consider EUR/USD approaching a major resistance level. When price touches this barrier with a buying climax signal, it suggests buyer exhaustion. This creates opportunities for contrarian positions anticipating rejection.
Trend continuation offers another valuable example. GBP/USD pullbacks accompanied by weak participation signals indicate lack of selling conviction. This provides low-risk entry points aligned with the primary trend.
Divergence patterns serve as early warnings. USD/JPY making new highs with declining activity suggests weakening momentum. Traders should exercise caution with new long positions during such conditions.
Range-bound markets reveal institutional activity through churn patterns. High participation with minimal price movement often precedes significant directional moves. Breakout confirmation requires substantial activity expansion to validate genuine moves.
Successful market participants combine these signals with price action and support/resistance levels. This comprehensive approach creates complete trading narratives for informed decision-making.
Insights from Leading MetaTrader 5 Resources
Online repositories of trading tools offer more than just downloads—they provide access to collective experience and peer validation. These platforms help traders identify the most effective analytical instruments through community-driven metrics.
Popular websites feature comprehensive libraries with detailed descriptions and user ratings. View counts help identify well-regarded tools within the Metatrader ecosystem.
Leveraging Trading Robots and Scripts
Trading robots automate strategies based on specific market patterns. Scripts available on MT5 platforms can execute trades when certain conditions appear.
Traders should thoroughly test any automated approach before live deployment. Many resources offer free downloads with community support.
User Reviews and Expert Ratings
Community feedback provides real-world testing insights from fellow traders. These reviews cover accuracy, reliability, and ease of use.
Expert assessments add another evaluation layer. Professionals examine technical sophistication and practical utility.
The Better Volume indicator exemplifies community-vetted tools. It attracted over 7,000 views since its 2025 publication.
Advanced Techniques for Volume Analysis
Seasoned traders employ specialized techniques that reveal hidden market dynamics. These advanced methods go far beyond simple bar observation.
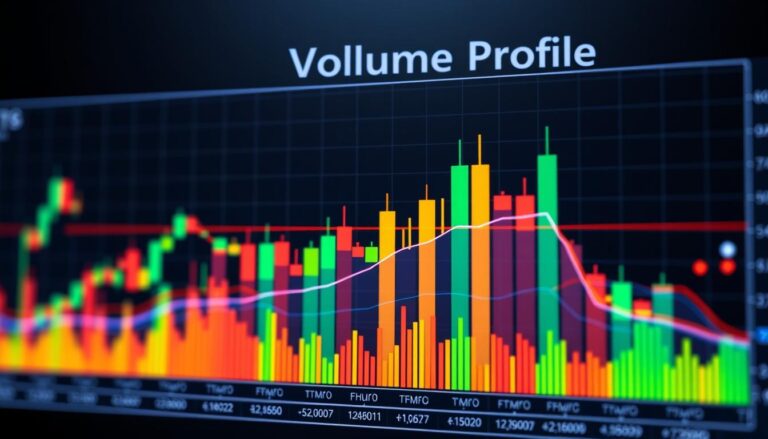
Volume profile analysis displays transaction concentration at specific price levels. This reveals where significant market activity occurred over time. These areas often become future support or resistance zones.
Rate-of-change calculations measure how rapidly participation expands or contracts. This provides earlier momentum warnings than simple comparisons. Traders can anticipate trend accelerations or decelerations more effectively.
Multi-timeframe examination represents another sophisticated approach. Practitioners seek alignment between shorter and longer period patterns. When expansion on smaller charts confirms larger timeframe trends, signals gain higher conviction.
Relative volume tools account for natural intraday patterns. They compare current activity to average levels for the same time of day. This filtering helps distinguish meaningful movements from normal fluctuations.
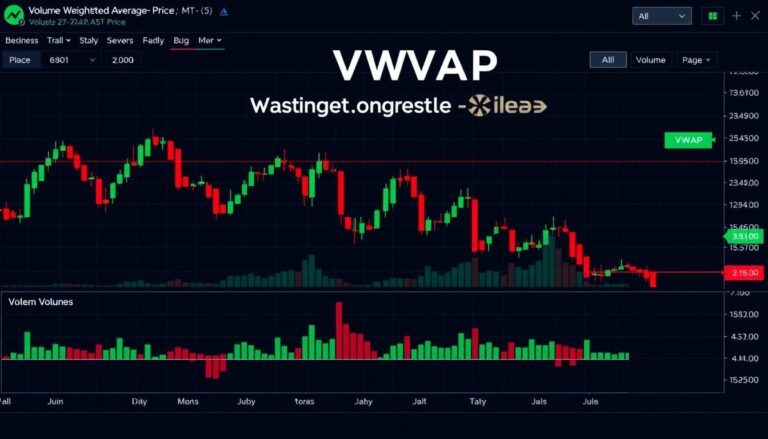
Volume-weighted average price (VWAP) combines price and participation data. It provides institutional-quality reference points for entry timing. Many professionals use this for trade evaluation and position management.
Cumulative delta techniques track buying versus selling activity differences. They create running totals showing which side dominates recent trading. This reveals underlying pressure even when price movement appears balanced.
Advanced practitioners often layer multiple analytical tools simultaneously. They might use one for trend identification and another for divergence detection. This creates confirmation systems that reduce false signals significantly.
The sheer number of available techniques demonstrates this field’s depth. Dedicated market participants have lifetime learning opportunities. Each method refines understanding of complex market behavior.
Best Practices for Effective Trading Volume Analysis
Mastering participation data interpretation involves cultivating habits that prevent common analytical pitfalls. Professional market participants understand that these tools serve as confirmation devices rather than standalone systems.
They consistently combine participation signals with price action and broader market context. This integrated approach creates more reliable decision-making frameworks.
Implementing Risk Management Strategies
Effective risk management must accompany participation analysis. Traders should establish position sizing rules that limit exposure on any single trade.
Stop-loss placement can incorporate participation data by positioning stops beyond levels where significant market activity previously occurred. These zones often represent areas where many participants established positions.
This protective approach safeguards capital when even strong signals occasionally fail. It ensures longevity in the challenging world of market participation.
Mastering Chart Interpretation
Chart interpretation skills improve through consistent practice and documentation. Maintaining detailed trading journals helps traders recognize recurring patterns.
Successful participants adapt their analytical style to match different market conditions and timeframes. They understand that patterns manifest differently across various trading environments.
Regular performance reviews create valuable feedback loops. This continuous refinement process separates amateur traders from professional market analysts.
Final Thoughts on Leveraging Volume Indicators for Trading Success
For traders seeking sustainable success, volume analysis represents the missing piece that transforms good strategies into great ones. This approach provides the crucial context that price data alone cannot deliver.
The journey from novice to expert requires dedication and time. Traders must accumulate experience observing how participation patterns precede price movements across different market conditions.
MetaTrader 5 offers an excellent platform with flexible tools and customization options. The active community continuously develops new resources, making sophisticated analysis accessible to all experience levels.
Success comes from developing consistent analytical processes rather than finding perfect settings. The most effective approach combines multiple perspectives to confirm trends and validate breakouts.
Traders should view this skill as compounding knowledge that eventually becomes intuitive understanding. While technology provides sophisticated tools, the fundamental principle remains unchanged.
Moving forward, those who commit to integrating this methodology position themselves to recognize opportunities others miss. This creates a significant edge in the competitive currency market.
Final success requires patience during learning periods and persistence in application. As traders progress, this analysis often becomes their most trusted framework for confident decision-making.

