Support Resistance Breakout MT4 Indicator for Forex Trading Strategies
Finding reliable entry points in the financial markets can be a major challenge. Many traders struggle with market noise and false signals. This often leads to missed opportunities and unnecessary losses.
A specialized trading tool has gained attention for addressing these common issues. It is designed to help traders identify high-probability setups with greater clarity. The system automates a crucial part of technical analysis.
This powerful indicator dynamically plots key price levels on the chart. It uses advanced algorithms to filter out irrelevant fluctuations. The goal is to provide clear signals only when a significant price move is likely.

Community feedback from major forex forums highlights its effectiveness. Users report impressive improvements in their strategy performance. The tool adapts to changing volatility, making it versatile across different market conditions.
Understanding the Support Resistance Breakout MT4 Indicator
The journey of a technical tool often mirrors the evolving needs of the trading community. This particular instrument helps traders spot crucial zones where market forces clash. It pinpoints areas where buying interest may strengthen or selling pressure could intensify.
This system scans past price action to find local highs and lows. These points form the foundation for key market levels. Unlike manual drawing, it uses algorithms for consistent results across various charts.
Indicator Evolution and Version History
The tool’s development shows a clear path of improvement. It started with a basic release in 2013. Significant upgrades followed over the years.
The 2022 version added a comprehensive alert system. Traders could get pop-up, email, and push notifications. This was a major step for timely trade execution.
The latest 2025 update brought even more power. Key additions include:
- Multi-timeframe analysis from a single chart.
- Visual arrows marking potential entry and exit points.
- Enhanced alert logic for more reliable signals.
These refinements address trader needs for accuracy and flexibility. The history of updates demonstrates a commitment to performance.
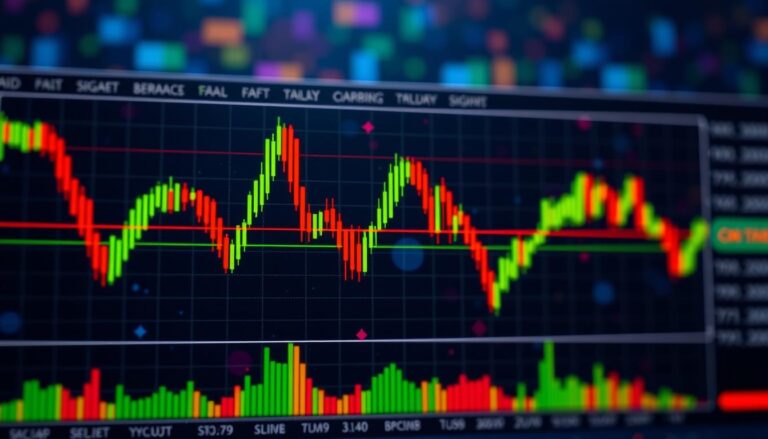
Key Features of the Support Resistance Breakout MT4 Indicator

Modern trading tools have evolved to provide clear visual representations of critical market zones where price action tends to cluster. This analytical instrument stands out through its sophisticated approach to identifying meaningful areas on charts.
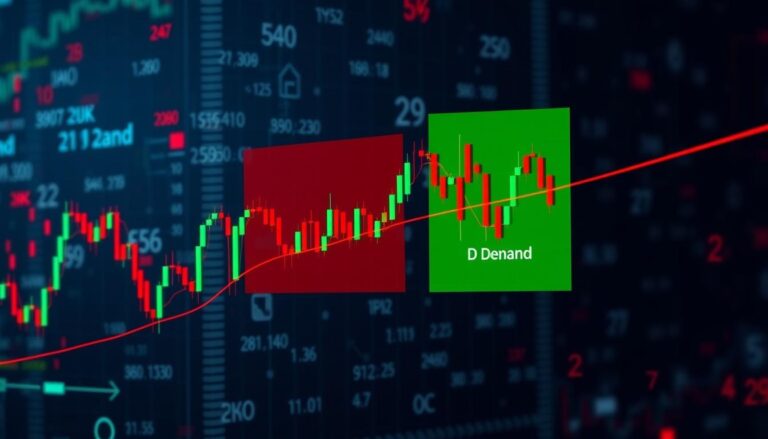
The system automatically marks important areas with color-coded rectangles. Green boxes highlight regions where buying interest typically emerges. Red boxes identify zones where selling pressure often dominates.
Zone detection uses advanced algorithms to filter out minor fluctuations. It focuses only on significant pivot points where multiple swings converge. This ensures traders see only the most relevant market levels.
Clear directional arrows provide immediate trading guidance. Green upward arrows signal potential buying opportunities. Red downward arrows indicate possible selling situations.
A crucial advantage is the non-repainting characteristic. Signals confirm only after candle completion, eliminating false alerts during price movement. This reliability makes the tool valuable for serious market participants.
The instrument exposes multiple data buffers for comprehensive analysis. These include volatility measurements and risk management parameters. This depth supports both manual trading and automated strategy development.
Visual customization options allow personal chart preferences. Traders can adjust colors, styles, and transparency to maintain clarity. This flexibility ensures the tool adapts to individual analytical needs.
Multi-Timeframe Analysis and Price Action

Multi-timeframe examination gives market participants deeper insights into how short-term and long-term trends interact. This approach allows traders to view the same asset from different perspectives simultaneously.
The system enables users to monitor key zones across various chart intervals. This provides context for both immediate moves and broader patterns.
Traders can configure the lookback period from 30 to 300 bars. This balances computational efficiency with sufficient historical context.
Role of ZigZag in Detecting Pivot Points
The ZigZag algorithm serves as the foundation for identifying significant turning points. It filters out minor fluctuations to highlight genuine market shifts.
Three configurable parameters control pivot detection: Depth sets the minimum bars between pivots, Deviation determines the required price change, and Backstep prevents overly close identifications. These settings help the tool focus on meaningful price movements.
Validating Support and Resistance Through Price Action
Price action validation occurs when zones demonstrate repeated influence on market behaviour. The system confirms levels through multiple tests showing consistent trader response.
Traders can choose between High/Low or Close price analysis. High/Low works better for short-term charts where wicks matter, while Close suits daily and weekly analysis.
The Period parameter controls historical depth, with higher values producing fewer but more significant signals. This requires stronger evidence of zone formation for reliable trading decisions.
Configurable Alerts, Signals and Customizable Visuals

Customizable alert systems transform technical analysis tools from passive chart instruments into active trading assistants. These features ensure market participants never miss critical opportunities while managing multiple positions.
Overview of Alert Systems and Notifications
The system offers four distinct notification types. Traders can enable pop-up messages, email alerts, mobile push notifications, and sound alerts independently.
Alert timing is controlled through the Trigger Candle parameter. Users choose between confirmed signals from closed candles or earlier warnings from developing price action.
When High/Low analysis is active, the tool can generate both buy and sell alerts within the same candle. This provides comprehensive coverage during volatile market conditions.
Personalizing Chart Settings for Clarity
Visual customization options allow traders to adapt the tool’s appearance to their preferences. Color schemes, line styles, and transparency levels can all be adjusted.
Signal arrows clearly mark breakout points on the chart. Green upward arrows indicate potential buy opportunities, while red downward arrows highlight sell situations.
These settings help maintain chart readability when analyzing complex price action. Proper configuration ensures critical signals stand out against background market noise.
Trading Strategy Integration & EA Compatibility

Expert Advisors depend on consistent data streams to execute trades with precision. This technical instrument bridges the gap between manual analysis and automated execution systems.
The tool provides algorithmic traders with eight distinct data buffers. These include ZigZag pivot values, ATR readings, and calculated risk management levels.
Seamless Integration with Expert Advisors
Full EA compatibility represents a significant advantage for systematic market participants. The exposed buffers eliminate complex custom coding requirements.
Traders can rapidly prototype and backtest automated approaches. The non-repainting characteristic ensures stable, confirmed signals for reliable automation.
Multi-symbol monitoring allows portfolio-based strategies across dozens of forex pairs. This enables sophisticated traders to scan multiple instruments simultaneously.
The instrument supports various trading methodologies including:
- Pure breakout approaches entering immediately upon signal generation
- Pullback strategies waiting for price retests of key levels
- Momentum continuation combined with trend confirmation tools
Integration with risk management tools through exposed buffers enables automatic position sizing. This maintains consistent risk-reward ratios across all trades.
Real-World Examples and User Experiences

Practical trading results provide the ultimate test for any technical analysis method. This section examines documented performance data from active market participants.
Community Feedback and Reported Success Rates
Major trading communities report impressive results with this approach. Users on platforms like Forex Factory and Reddit’s trading forums achieve approximately 75% accuracy in identifying valid moves.
Many traders experience win rate improvements of 15-30%. They combine the tool’s signals with basic confirmation techniques. This creates a more robust trading methodology.
The system proves particularly effective during choppy market conditions. It helps convert frustrating sideways action into profitable opportunities.
Case Studies in Forex and Other Markets
Forex case studies show consistent performance across major pairs like EUR/USD and GBP/USD. The tool identifies key levels where institutional activity often concentrates.
Successful applications extend beyond currency markets. Traders use the same principles for stock indices, cryptocurrencies, and commodities. The underlying market dynamics translate well across different assets.
Real examples include various scenarios from failed moves to strong trend continuations. Proper risk management remains essential for handling inevitable false signals.
Installation, Setup and Customization Guide

The deployment of this technical instrument begins with a simple download and setup procedure accessible to market participants. Traders can obtain the tool in various formats including .mq4 source files and compressed .zip archives for MetaTrader 4 platforms.
Installation follows standard MetaTrader protocols. Users download the file, navigate to File > Open Data Folder, and place the file in the MQL4/Indicators directory. After restarting the platform, the tool appears in the Navigator panel.
Dragging the instrument onto any chart opens the parameters dialog. This interface presents all customization options in an organized layout. The Period parameter defaults to 50 bars, balancing signal frequency with quality.
Traders can adjust this value based on market conditions. Lower values generate more signals during volatile periods. Higher values filter for only the most significant price movements.
The Price selection offers High/Low or Close modes. Short-term traders often prefer High/Low to capture wick penetrations. Position traders typically choose Close-based analysis for daily or weekly charts.
ZigZag sensitivity controls pivot point detection through Depth, Deviation, and Backstep settings. Conservative approaches benefit from higher values that filter minor swings. Active strategies may use lower values for more zone identifications.
Testing different parameter combinations on historical data helps identify optimal settings. This ensures the tool performs effectively with specific trading styles before live deployment.
Risk Management and Trading Efficiency
Managing potential losses is just as crucial as identifying profitable opportunities in market analysis. This technical approach integrates protective measures directly into its framework. It helps traders maintain discipline during volatile conditions.
The system automatically calculates logical exit points based on recent price swings. This removes emotional decision-making from protective stop placement. Traders see clear visual markers for both risk and reward levels.
Stoploss and Takeprofit Tools for Risk Control
Three distinct profit targets provide flexibility for different trading styles. Conservative traders can secure gains at the first level. More aggressive approaches can target extended moves during strong trends.
Risk-reward evaluation becomes straightforward with simultaneous display of all levels. Traders quickly assess whether setups meet their minimum criteria. This prevents entering trades with unfavorable potential outcomes.
ATR-Based Zone Calibration for Volatility Adaptation
Volatility adjustment ensures the tool remains effective across changing market conditions. During high-volatility periods, zones automatically widen to accommodate larger swings. Calm markets trigger tighter zones for precision entries.
The default ATR multiple of 0.5 filters insignificant price fluctuations. Traders can adjust this threshold based on their risk tolerance. Higher values produce fewer signals but potentially higher quality setups.
This dynamic adaptation reduces frustrating whipsaw trades. Protective stops position beyond normal volatility ranges. The result is more reliable trade execution with improved capital preservation.
Market Reception and Community Feedback
Market adoption patterns reveal much about a trading instrument’s practical utility and reliability among professional users. The analytical tool has gained significant traction across major financial communities.
Insights from Trading Forums and Discussions
Platforms like Forex Factory and Reddit’s trading communities showcase positive user experiences. Many traders report converting difficult market conditions into profitable opportunities.
The objective approach eliminates emotional bias from technical analysis. Successful users combine signals with broader market context for better results.
Developer responsiveness enhances the tool’s reputation. Ongoing updates address user feedback and specific needs. Custom programming services allow personalization for unique trading strategies.
Realistic expectations contribute to user satisfaction. The instrument works best when combined with sound principles and disciplined execution.
Final Thoughts and Future Developments
Successful trading requires a systematic approach that combines analytical tools with disciplined execution. This technical solution serves as a must-have for traders harnessing price action dynamics. It offers automated zone detection and actionable signals to drive consistent gains.
Future developments may incorporate machine learning algorithms and adaptive parameter optimization. Enhanced multi-asset correlation analysis could provide deeper market insights. The developer remains committed to ongoing refinement based on user feedback.
Traders should view this tool as a foundational component rather than a standalone solution. Proper testing across different market conditions builds confidence before live deployment. Custom programming services allow personalization for unique strategies.
The instrument’s core strengths—including non-repainting signals and integrated risk management—position it for professional use. As financial markets evolve, systematic approaches to identifying high-probability opportunities will remain valuable for serious market participants.