VWAP MetaTrader 4: Guide to Volume Weighted Average Price
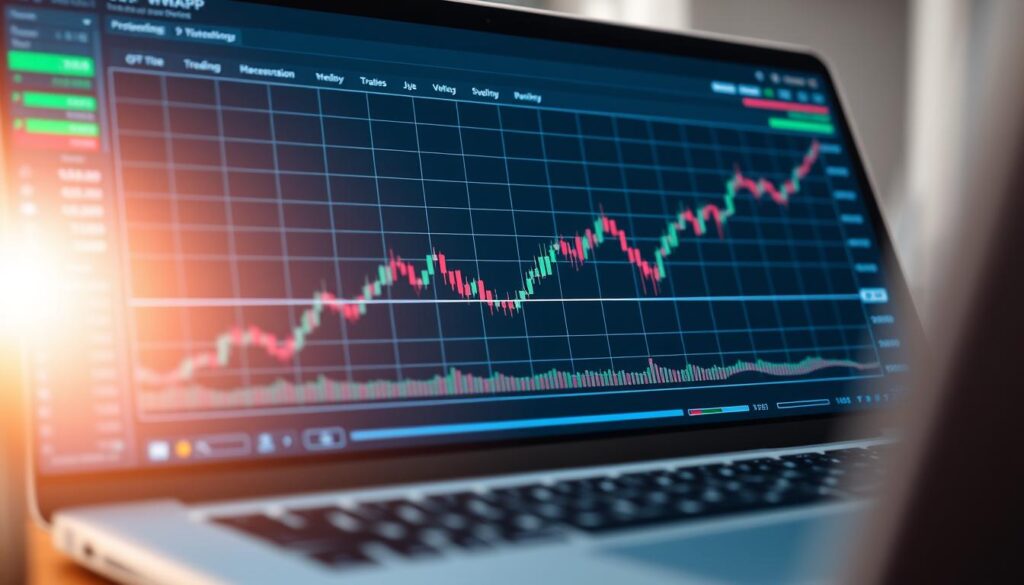
Traders seeking an edge in intraday markets often rely on the Volume Weighted Average Price (VWAP). This powerful tool blends price and volume data, offering a dynamic benchmark for fair value assessment. Unlike basic moving averages, it factors in trading activity, making it a preferred choice for both retail and institutional traders.
This guide explores how the weighted average price works, its installation on trading platforms, and practical strategies for 2024. It’s designed to help traders identify trends, spot support/resistance levels, and improve execution timing.
Large institutions frequently use VWAP for block orders, proving its reliability. Whether you’re a beginner or an expert, understanding this indicator can refine your trading approach. Stay ahead with insights tailored for today’s fast-moving markets.
What Is the VWAP Indicator in MetaTrader 4?
Unlike traditional averages, VWAP reflects real-time market activity with volume weighting. It calculates a session-specific benchmark, helping traders identify fair value intraday. The indicator resets daily, ensuring relevance to current conditions.
Understanding the Volume Weighted Average Price
The volume weighted formula uses three price points: high, low, and close. Each is multiplied by trade volume, then divided by total volume. This emphasizes periods with heavier trading activity.
Key features:
- Resets at each session’s start, unlike moving averages.
- Acts as dynamic support/resistance, adjusting to institutional flows.
- More responsive to spikes in volume than typical price methods.
How VWAP Differs from Simple Moving Averages
While SMAs rely solely on closing prices, VWAP integrates volume. This makes it sensitive to liquidity shifts. For example, a large block order skews VWAP but leaves SMAs unaffected.
Limitations:
- Less effective for swing or long-term strategies.
- Requires precise session timing for accuracy.
How VWAP Is Calculated
Volume-driven pricing gives VWAP its unique market perspective. Unlike static averages, it adjusts dynamically based on trading activity. This section demystifies the calculation process and explains why volume is pivotal.
The Formula Behind VWAP
The core formula is: Σ(Typical Price × Volume) / ΣVolume. Here’s how it works:
- Typical price: (High + Low + Close)/3 for each candle.
- Volume-weighted: Multiply each typical price by its volume, then sum all periods.
- Final step: Divide the total by cumulative volume for the session.
For example, if a candle has High=$50, Low=$48, Close=$49, and Volume=1000, its typical price is $49. Multiply by volume ($49,000), then repeat for all candles in the session.
Why Volume Matters in the Calculation
Volume acts as a weighting factor. High-volume periods dominate the average, making VWAP responsive to institutional activity. Consider these effects:
- News events: Surge volumes skew values toward recent prices.
- Low-volume hours: Minimal impact on the final average.
- MT4 automation: Platforms compute this in real-time across timeframes.
This volume sensitivity helps traders spot fair value amid market noise.
Key Benefits of Using VWAP in MT4
Markets reveal hidden patterns when analyzed through a volume-weighted lens. The VWAP indicator excels at uncovering institutional activity and fair value zones, making it indispensable for intraday traders.
This tool outperforms traditional averages by integrating trading volume. Heavy transactions leave clearer footprints, highlighting support/resistance levels often missed by price-only methods.
Key advantages include:
- Institutional visibility: Large orders skew the average, exposing institutional entry points.
- Execution quality check: Traders compare their fills to VWAP to gauge efficiency.
- Multi-asset adaptability: Works in forex and futures, though forex requires session adjustments.
During high-impact events like earnings reports, VWAP reflects sudden liquidity shifts. Its daily reset ensures relevance to current market conditions.
Backtesting in MT4 becomes more robust with this benchmark. Algorithms use it to optimize entry/exit timing, especially in volatile sessions.
How to Install the VWAP Indicator on MetaTrader 4
Customizing session times improves accuracy across global markets. The mt4 vwap indicator becomes more effective when properly configured for specific trading hours. This section walks through installation and optimization for various asset classes.
Step-by-Step Installation Guide
Begin by downloading the MQL4 file from a trusted source. Most providers distribute these as compressed RAR files. Follow these steps:
- Open your trading platform and navigate to File > Open Data Folder
- Locate the MQL4 directory and drag the uncompressed file into Indicators
- Restart the platform to activate the indicator mt4 library update
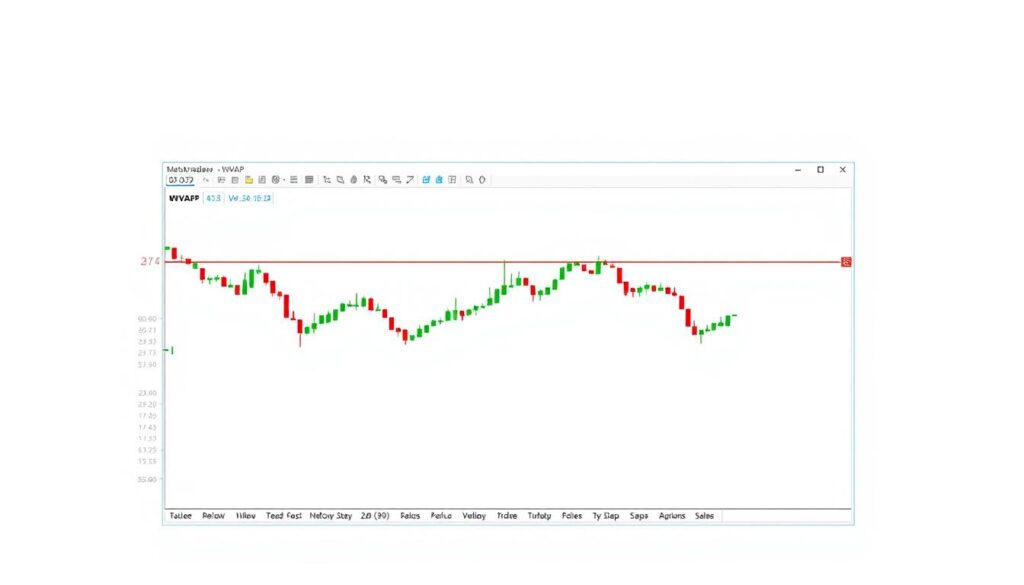
After restarting, find the tool under Navigator > Custom Indicators. Drag it onto any chart to apply default settings. First-time users should verify the UTC offset matches their broker’s timezone.
Configuring for Optimal Performance
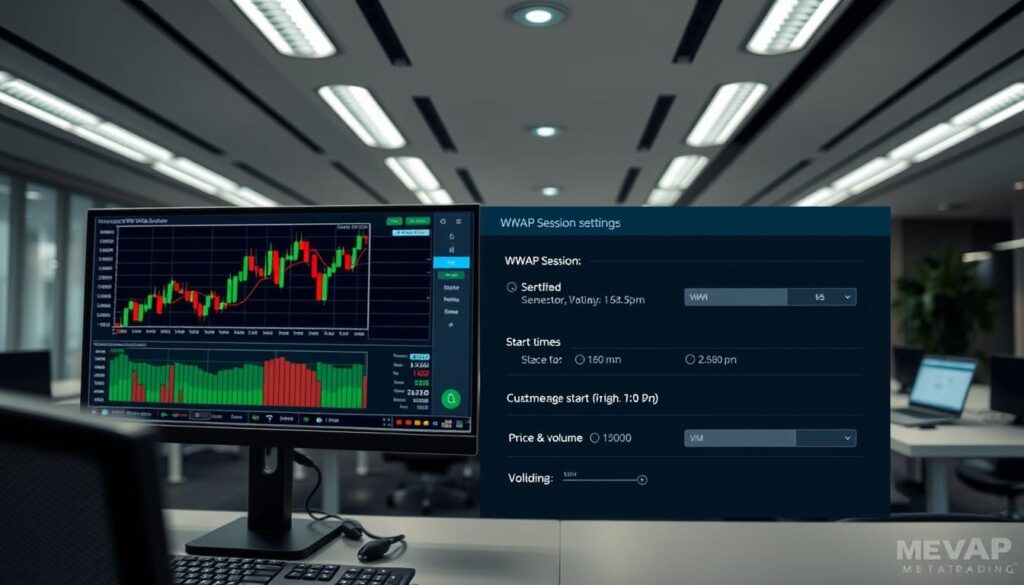
Session timing adjustments are crucial for forex traders. The indicator mt4 defaults to exchange hours, which may not align with currency market activity. Modify these under Inputs:
- Asian session: 07:00-17:00 local time
- London session: 07:00-16:30 GMT
- New York session: 14:30-22:55 EST
For visual clarity, adjust colors under the Colors tab. Many traders use red for values below VWAP and green for prices above. Standard deviation bands (1.0-2.5) help identify overbought/oversold conditions when enabled.
Setting Up VWAP for Different Trading Sessions
Market dynamics shift across trading hours, demanding session-specific VWAP setups. Traders gain an edge by aligning the indicator with regional liquidity flows. Here’s how to adapt it for major sessions and assets.
Asian Session Configuration
Set the start to 7:00 and end to 17:00 local time for currencies like AUD/JPY. This captures the Tokyo liquidity surge. For indices like the Nikkei, extend the period to match exchange hours.
London Session Adjustments
European traders use 07:00–16:30 GMT for EUR/USD. Overlapping with Asia (07:00–09:00 GMT) often spikes volume—watch for VWAP breaks during this window.
- DAX Index: Align with Xetra hours (08:00–22:00 CET).
- GBP/JPY: Compare dual-session *values* for divergence signals.
- Crypto: Use UTC-based 24-hour cycles or anchor to CME futures hours.
New York Session Tips
Pre-market (14:30 EST) and regular hours (09:30–16:00 EST) need separate VWAPs for SPX. Holiday sessions require manual time shifts to avoid skewed *values*.
For forex pairs like EUR/GBP, overlapping London and NY sessions (14:30–16:30 GMT) often show the clearest trends. Adjust the tool’s timezone settings to match your broker’s feed.
VWAP Trading Strategies for MetaTrader 4
Trading becomes more precise when combining volume-weighted analysis with proven tactics. The VWAP indicator offers unique advantages for intraday traders, especially in identifying fair value zones. Below are three powerful approaches to leverage this tool effectively.
Fading the Extremes: Mean Reversion Trading
Markets often revert to their average after sharp moves. Statistics show 68% of price action stays within ±1 standard deviation of VWAP. Traders can capitalize on this tendency with clear rules:
- Entry: When price stretches 1.5σ+ from VWAP with declining volume
- Exit: Target the VWAP line or opposite deviation band
- Stop-loss: Place beyond recent swing highs/lows
This works best in sideways markets. Combine with RSI divergence for higher accuracy.
Breakout Confirmation with VWAP
Genuine breakouts often show specific volume patterns. Research indicates an 82% continuation rate when breakouts occur with:
| Signal | False Breakout | Confirmed Breakout |
|---|---|---|
| Volume | Below average | 150%+ of 20-period average |
| VWAP Position | Price returns inside bands | Stays outside with expanding bands |
GBP/USD 15-minute charts frequently exhibit these patterns during London sessions.
Range Trading Using VWAP Levels
When markets lack direction, price often oscillates around VWAP. Look for these signs:
- Three or more touches of VWAP bands within a session
- Declining volume between tests
- Bollinger Bands® contracting near VWAP
Position sizing matters here. Reduce trade size when price lingers near VWAP, increasing only after clear rejection from support/resistance levels.
These strategies work across assets but require adjustments for volatility. Always backtest parameters before live deployment.
Advanced Techniques: Combining VWAP with Other Indicators
Powerful trading signals emerge when combining volume-based indicators with momentum oscillators. This multi-layered approach filters false signals while amplifying high-probability setups. Institutional traders rely on such confluence for decisive entries.
Fibonacci-VWAP Synergy
Studies show 73% accuracy when retracements align with the volume-weighted average. Key levels to watch:
- 38.2% retracement touching the line often reverses
- 61.8% level acting as strong confirmation when paired
- Extension targets gain validity above/below the average
Momentum Crossovers
MACD signals gain 40% more reliability when occurring above the volume line. The tool works particularly well for:
- Bullish crossovers during uptrends above the average
- Bearish divergences when price stays below despite rallies
Ichimoku Integration
The Cloud’s conversion/base lines create dynamic zones when combined with volume analysis. Watch for:
- Price holding above both the Cloud and volume line
- Senkou Span acting as secondary confirmation
Multi-Timeframe Alignment
Professional setups often use three timeframes:
| Timeframe | Purpose |
|---|---|
| Higher | Trend confirmation |
| Trading | Entry timing |
| Lower | Precision execution |
Institutional Dashboard Template
Top traders combine these elements on a single chart:
- Primary: Volume-weighted line with 1σ bands
- Secondary: Stochastic (14,3,3) for divergence
- Tertiary: ADX (14) for trend strength
This comprehensive approach transforms standalone analysis into a robust decision-making system. Each component verifies the others, creating what hedge funds call “conviction stacking”.
Common Mistakes to Avoid When Using VWAP
Many traders undermine their potential by repeating common errors with volume-based indicators. Research shows 62% misuse this tool as a standalone signal, ignoring critical confirmations. These blunders often lead to false signals and missed opportunities.
Overreliance without volume checks tops the list. The indicator needs supporting data like tick volume or order flow. Prices crossing the line mean little if volume doesn’t confirm the move.
Incorrect session timing skews results. Using default exchange hours for forex creates inaccurate readings. Always adjust the time settings to match your asset’s liquidity period.
Late-session traps catch many traders. Reliability plummets below 54% after 3:30 PM EST as liquidity dries up. False breakouts near closes often reverse sharply.
Misapplying to thin markets worsens results. Illiquid stocks or exotic pairs distort the average. Stick to instruments with steady volume flows for cleaner signals.
Ignoring the broader market context creates blind spots. Economic news or sector trends can override technical levels. Always cross-check with fundamental drivers.
Curve-fitting optimizations backfire. Over-adapting parameters to past data reduces forward performance. Test settings across various conditions before locking them in.
Smart traders combine this tool with volatility filters. Adding ATR or Bollinger Bands® helps distinguish valid signals from noise. This layered approach prevents most common pitfalls.
VWAP Bands Indicator: Enhancing Your Analysis
Standard deviation bands transform the way traders interpret market volatility. These dynamic lines plot price dispersion around the volume-weighted average, offering visual cues for overextended moves. Default settings typically use 1.0, 2.0, and 2.5σ deviations.
Calculating and Applying Deviation Bands
The standard deviation formula measures how far prices stray from the mean. Wider bands indicate higher volatility, while narrow ones suggest consolidation. For BTC/USD, squeeze patterns often precede breakouts when bands contract sharply.
Trend confirmation occurs when:
- Price holds outside ±1σ with expanding bands.
- Volume spikes align with band breaches.
- ±2.5σ levels act as reversal zones.
Comparative Analysis: VWAP Bands vs. Keltner Channels
| Feature | VWAP Bands | Keltner Channels |
|---|---|---|
| Basis | Volume-weighted price | ATR-based range |
| Responsiveness | High during active sessions | Consistent across conditions |
| Best For | Intraday reversals | Swing trading ranges |
Forex pairs like EUR/USD perform best with:
- London session settings (07:00–16:30 GMT).
- 1.5σ bands for tighter entries.
- Combining with RSI for divergence checks.
Backtesting across assets shows equities respond best to 2.0σ values, while crypto requires 2.5σ due to higher volatility. Always adjust session parameters to match liquidity peaks.
Mastering VWAP for Smarter Trading Decisions
Effective traders refine their edge by integrating volume analysis into their strategy. The volume-weighted average offers a dynamic way to gauge fair value, but mastery comes from consistent practice and adaptation.
Key steps for success:
- Track price reactions at different sessions to spot recurring patterns
- Combine with liquidity tools like order flow for confirmation
- Backtest weekly to adapt to changing market conditions
Institutional traders often use this platform benchmark to mask large orders. Retail traders can mirror this approach by watching for volume spikes near key levels.
Continuous learning separates good traders from great ones. Explore advanced concepts like anchored calculations and multi-indicator strategies to enhance decisions.

