Half Trend Indicator MT4: A Trading Tool Explained
Navigating financial markets requires tools that simplify complex data. One popular solution combines visual clarity with technical precision, helping traders spot opportunities without overwhelming analysis. This system uses colored lines and arrows to highlight market movements, making it accessible even for those new to chart patterns.
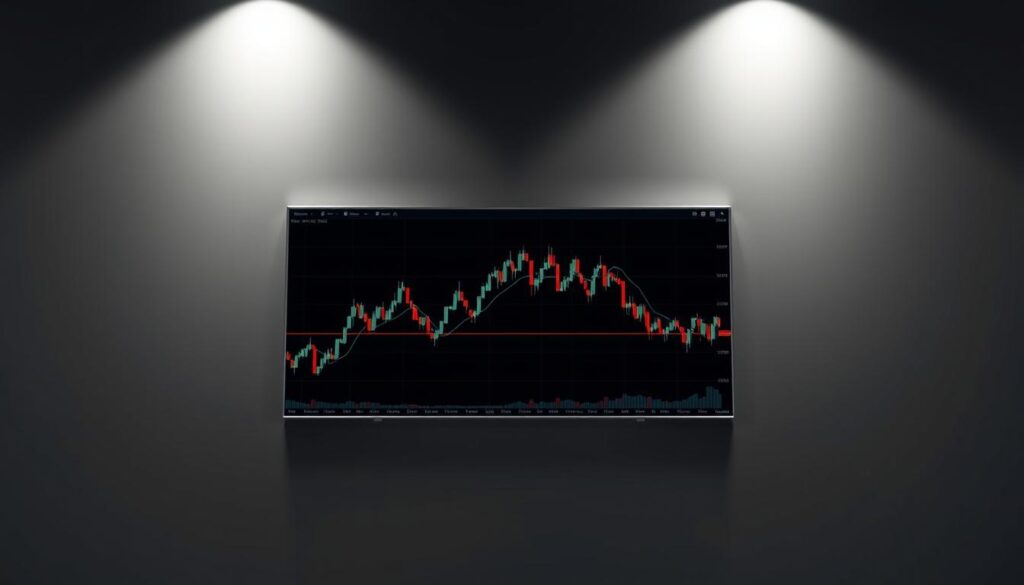
Built around a moving average foundation, the tool adapts to shifting market conditions. It identifies trend directions and potential reversals by analyzing price action on candlestick charts. Traders receive clear signals through simple graphical elements, reducing guesswork during fast-paced sessions.
The methodology works across multiple asset classes, including forex and commodities. Its strength lies in balancing simplicity with actionable insights – ideal for executing strategies in volatile markets. By filtering noise, users focus on high-probability setups while managing risk effectively.
Both beginners and professionals appreciate the straightforward interface. Customizable settings allow adjustments for different trading styles, from scalping to position trading. This flexibility makes it a practical addition to any technical analysis toolkit.
Understanding the Half Trend Indicator
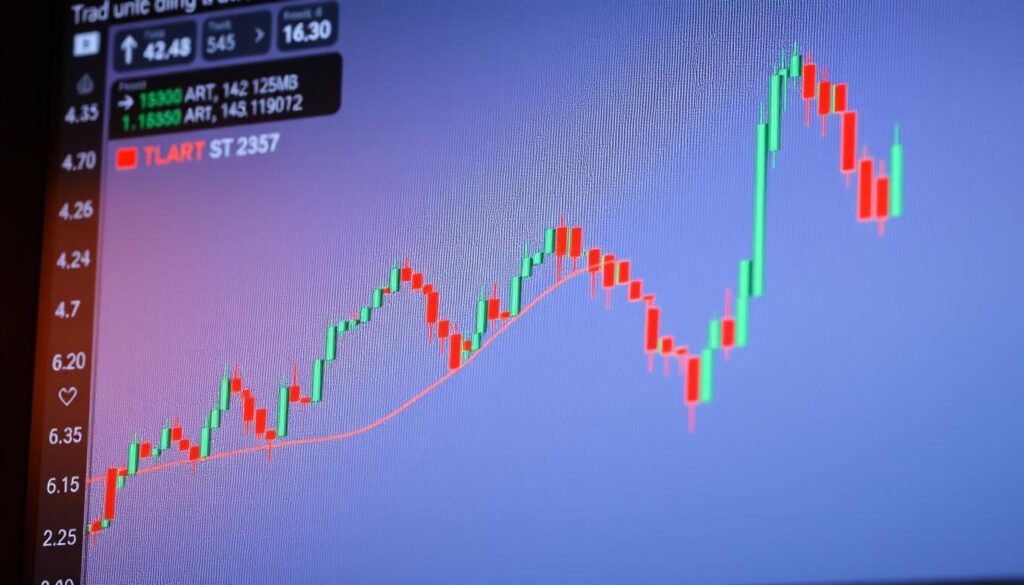
Successful traders rely on tools that turn market chaos into clear opportunities. The Half Trend system transforms price action into visual signals using moving averages. Colored arrows on candlestick charts highlight shifts in momentum, allowing quick interpretation of market behavior.
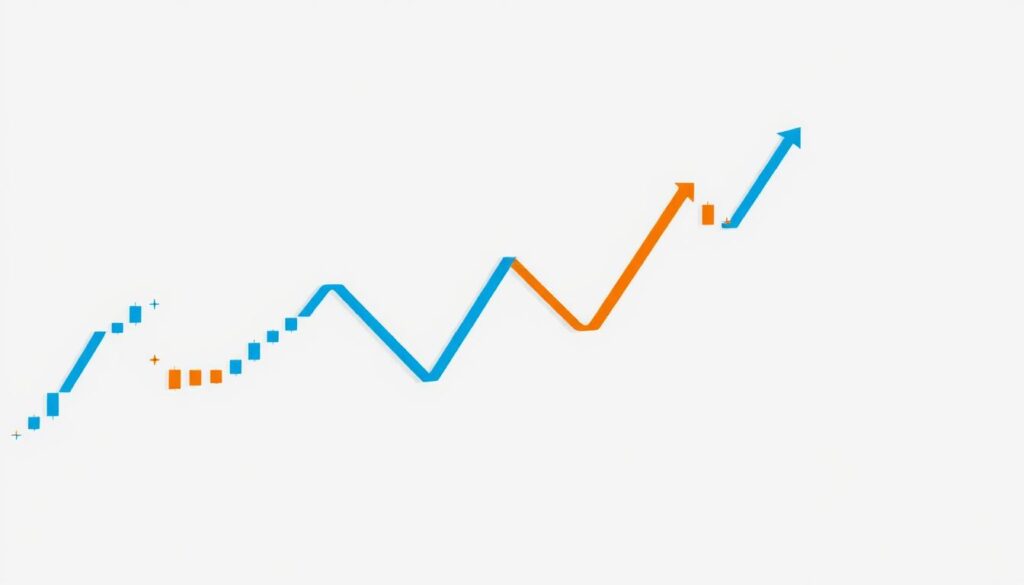
Blue markers suggest upward price movement, signaling traders to consider long positions. Conversely, red markers appear when downward pressure dominates, hinting at potential exits or short opportunities. This color-coded approach removes ambiguity, especially during volatile sessions.
Three core benefits make this tool valuable:
- Identifies trend shifts earlier than basic chart patterns
- Works across forex pairs and commodity markets
- Requires minimal manual interpretation
The methodology filters out minor price fluctuations, focusing on significant movements. By combining historical data with current price action, it creates a dynamic framework for decision-making. Traders gain confidence through objective signals rather than emotional guesses.
Customization options let users adjust sensitivity based on their strategy. Day traders might prefer tighter settings, while long-term investors could opt for broader trend confirmation. This adaptability ensures relevance across different timeframes and market conditions.
What is the Half Trend Indicator MT4?
Technical analysis thrives on tools that balance precision with user-friendly design. Unlike traditional indicators that overwhelm with complexity, this MetaTrader 4-specific solution transforms price movements into actionable signals through colored arrows. Blue markers highlight emerging upward momentum, while red ones flag potential downward shifts. Its moving average foundation filters market noise, offering clarity in fast-moving sessions.
The system employs advanced calculations to distinguish meaningful patterns from temporary fluctuations. By merging historical data accuracy with real-time responsiveness, it creates reliable signals across multiple timeframes. Traders appreciate its consistent performance during both calm and volatile market phases.
Three standout features define its utility:
- Customizable parameters aligning with diverse trading strategies
- Seamless integration with other MT4 charting tools
- Visual cues that reduce interpretation time
Adaptable algorithms automatically adjust to different assets, from major currency pairs to energy commodities. This versatility helps traders maintain edge across markets without constant manual tweaks. When combined with complementary technical tools, it forms a robust framework for decision-making.
Key Components of the Indicator
Clear visual components form the backbone of efficient trading decisions. This system combines dynamic graphical elements with precise calculations, offering traders immediate insights without complex interpretations. Two primary features drive its effectiveness in live markets.
The Trend Line and Its Significance
The blue line serves as the system’s compass, revealing market direction through its slope. When ascending, it confirms upward momentum – a green light for potential long positions. A downward slope signals bearish control, prompting traders to consider protective measures or short opportunities.
Positioning relative to price action matters. If candles remain above the line during uptrends, confidence in bullish strength grows. Breakouts below the line during downward slopes often precede accelerated selling pressure.
Arrows as Visual Trading Signals
Colored markers eliminate second-guessing. A blue arrow appears at optimal entry points for upward moves, while red arrows flash when downward shifts gain traction. These signals achieve three critical goals:
- Pinpoint exact moments of trend initiation
- Reduce emotional decision-making
- Work across various timeframes consistently
The arrows’ reliability stems from their algorithmic foundation. They only activate when price action and momentum align, filtering out false moves that trap inexperienced traders. Combined with the trend line, they create a complete decision-making framework for entries, exits, and trend confirmation.
How the Indicator Works in Real-Time Trading
Effective trading strategies depend on tools that translate raw data into timely insights. This system processes live price movements through mathematical models, merging historical patterns with current market behavior. The result? Visual cues that guide decisions without overwhelming traders with complex calculations.
Movement Based on Moving Average and Price History
At its core, the tool calculates direction by comparing asset prices to their average values over specific periods. When current values consistently stay above this baseline, upward momentum builds. Historical patterns help confirm whether these movements signal lasting shifts or temporary spikes.
The algorithm filters minor price swings, focusing on meaningful deviations. This balance prevents false alarms during sideways markets while remaining responsive to genuine trend changes. Traders see clearer signals during strong directional moves, reducing hesitation in fast-paced environments.
Reaction to Market Fluctuations
While responsive, the system naturally lags behind sudden price jumps – a trade-off for reliability. It prioritizes confirmed movements over predicting exact reversal points. During volatile periods, this approach helps avoid whipsaw signals that lead to premature entries or exits.
Three factors determine its performance:
- Strength and duration of price momentum
- Alignment between short-term and long-term averages
- Consistency in trading volume
Blue signals emerge when conditions favor sustained upward movement, suggesting long opportunities. These markers gain reliability when supported by higher timeframes and complementary technical factors. Understanding this interplay helps traders separate high-probability setups from noise.
Best Market Conditions for Using the Half Trend Indicator
Markets reveal their best opportunities when conditions align with analytical tools. The system excels during sustained directional movements, where prices move decisively upward or downward. These environments allow its algorithm to filter noise effectively, producing fewer misleading alerts compared to choppy or sideways markets.
- Consistent price momentum lasting multiple trading sessions
- Higher timeframes (H1 or daily charts) showing aligned signals
- Absence of major economic announcements causing erratic swings
Forex trading pairs like EUR/USD often showcase these conditions during trending phases. The methodology struggles during consolidation periods, where frequent crossovers between price and averages trigger premature signals. Traders should verify market direction using supplementary tools before acting on alerts.
Timeframe selection significantly impacts performance. Hourly charts and above provide cleaner data by smoothing out minor fluctuations. This helps traders avoid being whipsawed by temporary retracements within larger trends.
Seasonal patterns and macroeconomic events can enhance effectiveness. For example, energy commodities often trend predictably during winter demand spikes. Combining these fundamental insights with the tool’s signals creates a powerful synergy for decision-making.
Trading with the Half Trend Indicator
Executing trades effectively requires understanding precise trigger points. The system shines when traders follow its visual cues with discipline, combining signals with smart risk management.
Entry Conditions for Bullish Trends
A blue arrow marks the start of upward momentum. Traders should verify three factors before entering:
- Price stays above the blue line
- Recent swing low remains intact
- No conflicting signals from higher timeframes
Enter immediately after the arrow appears. Place stop-loss orders 5-10 pips below the nearest support level. This protects against false breakouts while allowing room for normal market fluctuations.
Exit Strategies in Bearish Trends
Red arrows signal potential downturns. Exit long positions when these markers appear near resistance zones. For short trades, set profit targets at previous support levels identified through horizontal price action.
Maintain a 1:2 risk-reward ratio. If stop-loss is 20 pips, aim for 40-pip gains. This approach ensures profitability even with a 50% success rate across trades.
Enhancing Trading Strategy with Complementary Tools
Building a reliable trading system involves combining complementary analytical methods. While the primary tool offers clear signals, pairing it with momentum oscillators and trend filters strengthens decision-making. This layered approach helps traders separate high-probability setups from market noise.
RSI and EMA Synergy for Confirmation
The Relative Strength Index (RSI) adds crucial context to entry signals. When the main system suggests a bullish move, traders check if RSI remains below 70 to avoid overbought traps. Conversely, oversold readings above 30 during bearish signals increase confidence in downward momentum.
Incorporating the 50-period EMA creates a trend bias framework. Prices trading above this moving average suggest broader upward momentum – ideal conditions for acting on bullish alerts. Three key benefits emerge:
- Filters out counter-trend signals during ranging markets
- Aligns short-term entries with longer-term direction
- Reduces emotional trading through objective criteria
During bearish setups, the EMA crossover acts as final confirmation. A valid short signal occurs only when price breaks below both the system’s line and the 50 EMA. This dual verification process significantly improves trade accuracy across forex and commodity markets.
Successful traders maintain simplicity by using these tools as confirmation layers rather than standalone systems. Proper integration creates a robust strategy that adapts to changing volatility while keeping analysis time-efficient.
Ideal Settings for the Half Trend Indicator on MT4
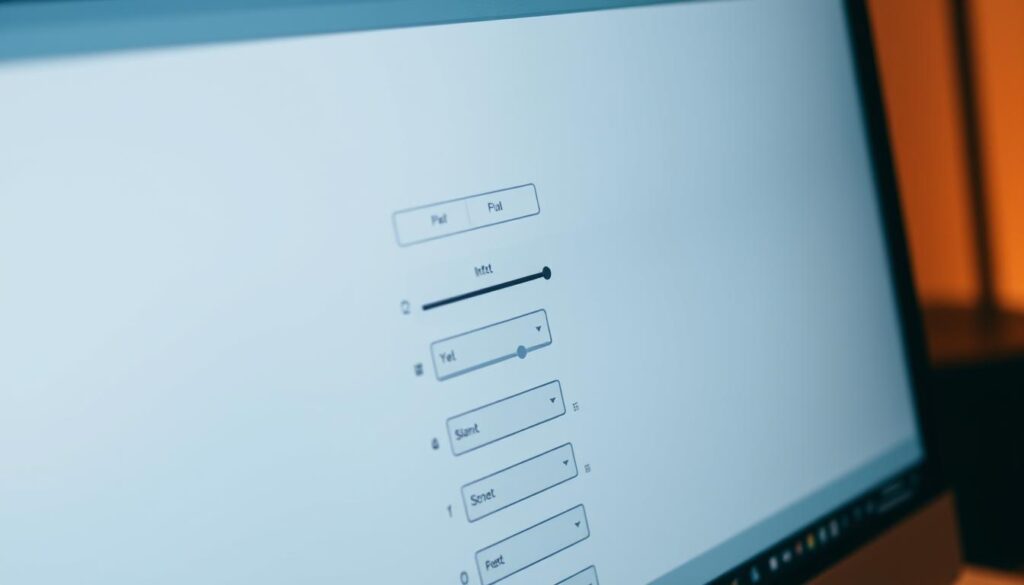
Optimising technical tools requires balancing responsiveness with reliability. The system’s default configuration works well for general use, but strategic adjustments enhance performance in specific market scenarios. Traders achieve this by modifying amplitude values – lower numbers (2-6) increase sensitivity for short-term moves, while higher settings (8+) smooth out noise in longer trends.
Amplitude adjustments directly impact signal accuracy. Consider these guidelines:
- Scalping: Use 2-4 amplitude for rapid price reactions
- Day trading: 5-6 balances speed and stability
- Swing trading: 8+ filters minor fluctuations
Timeframe selection complements these settings. Hourly charts (H1) or higher reduce false alerts by ignoring insignificant price jumps. This pairing creates cleaner signals during London and New York trading sessions when volatility peaks.
Visual customisation improves decision speed. Blue lines for upward momentum and red for downward shifts create instant visual recognition. Combine this with thicker line weights during high-impact news events to maintain focus.
Testing remains crucial. Backtest configurations across three market phases – trending, ranging, and volatile. Forward-test promising settings in demo accounts for one week minimum. This dual approach validates performance before risking capital.
Managing Risk While Trading with the Indicator
Smart traders know profits mean nothing without protection. The half trend system excels at spotting opportunities, but only works when paired with disciplined risk management. Forex trading’s volatility demands clear rules for handling unexpected reversals.
Always set stop-loss orders below recent swing lows after entry signals. This limits losses if false alerts occur. Combine this with 1:2 risk-reward ratios – risking 1% per trade while targeting 2% gains maintains account health.
Verify signals across timeframes to filter false positives. If hourly charts show bullish momentum but daily charts conflict, pause entries. Update your trading strategy quarterly by reviewing win rates and adjusting position sizes accordingly.

