SSL Channel Chart Alert MT4 Indicator Guide
The financial markets demand tools that simplify decision-making, and the SSL Channel Chart Alert MT4 indicator delivers precisely that. Traders rely on this dynamic solution to interpret price movements through a unique blend of moving averages. Its ability to highlight trend shifts without complex formulas has made it a staple in modern technical analysis.
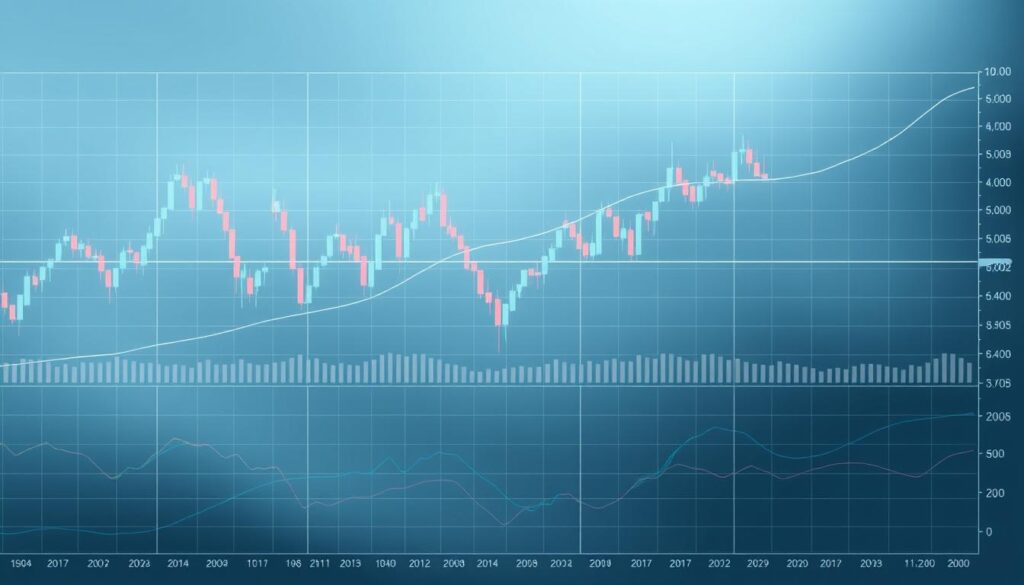
At its core, the tool calculates two 10-period averages—one tracking highs and another monitoring lows. These values form an adaptive envelope around price action, creating visual boundaries that reflect market momentum. When the lines cross, they signal potential reversals, offering clear opportunities for entry or exit.
What sets this indicator apart is its responsiveness. Unlike static overlays, it adjusts to volatility, making it ideal for fast-paced trading environments. Users appreciate how it reduces guesswork by translating raw data into actionable insights.
Both beginners and seasoned professionals find value in its straightforward design. The color-coded system enhances readability, while customizable alerts keep traders informed without constant screen monitoring. This balance of simplicity and precision explains its growing adoption across global markets.
Understanding the SSL Channel Indicator
Market analysis thrives on clarity, and the Semaphore Signal Level delivers precisely that. This methodology converts raw price action into intuitive visual cues using two dynamic lines. These elements adapt to market conditions, offering traders a straightforward way to spot directional shifts.
Overview of Semaphore Signal Level
The system tracks price extremes through two 10-period averages. One line follows session highs, while the other maps lows. When these lines cross, they create distinct color changes that signal potential trend reversals. This approach filters out minor fluctuations, focusing traders on meaningful price movements.
The Role of Moving Averages in Trend Detection
Traditional moving averages often lag behind rapid market changes. The SSL framework solves this by using parallel calculations that respond to volatility. The dual-line structure creates a responsive envelope, highlighting momentum shifts faster than single-line tools. Traders use these crossings to confirm entries or exits during active sessions.
Customizable time settings allow adjustments for different assets. Shorter periods increase sensitivity, while longer ones smooth out noise. This flexibility makes the system adaptable across forex pairs and time frames. Combined with visual alerts, it becomes a powerful ally in fast-moving markets.
Key Features and Benefits of the Indicator
Effective market analysis depends on tools that balance precision with adaptability. This system combines mathematical rigor with practical design, offering features that enhance decision-making across volatile conditions. Traders gain access to two core innovations that address common challenges in technical analysis.
Dual SMA Channels and Customizable Period
The framework uses parallel moving averages to track price extremes. Separate calculations for session highs and lows create a responsive envelope around market activity. Unlike single-line tools, this dual approach captures momentum shifts faster while filtering out minor fluctuations.
Users can adjust the default 10-period setting to match their strategy. Shorter intervals increase sensitivity for scalping, while longer ones smooth noise in swing trading. This flexibility helps traders adapt to currencies, commodities, or indices without rewriting formulas.
Non-Repainting Signals for Reliable Backtesting
Historical accuracy remains crucial for strategy validation. Once a price bar closes, the generated signals remain fixed permanently. This prevents misleading changes to past data, ensuring backtests mirror real-world performance.
The multi-alert system supports three notification formats: platform pop-ups, mobile pushes, and emails. Traders maintain awareness of emerging trends without constant screen checks. Combined with automated trading compatibility, these features reduce emotional fatigue during extended sessions.
Installing and Configuring the MT4 Indicator
Proper setup forms the foundation for accurate market analysis. The SSL Channel Chart Alert integrates seamlessly with MetaTrader 4, though correct installation ensures optimal performance across devices. Traders need basic file management skills and a functioning MT4 platform to begin.
Step-by-Step Installation Process
- Download the indicator file (.ex4 or .mq4) from a verified provider
- Open MT4 and select “File” > “Open Data Folder” from the top menu
- Navigate to MQL4 > Indicators and paste the downloaded file
- Restart the platform or refresh the indicator list
- Drag the tool from the Navigator window onto any trading chart
Verify installation by checking the platform’s Navigator panel. If the tool appears under “Custom Indicators,” it’s ready for use. Common issues include misplaced files or incomplete downloads—double-check folder paths and file integrity.
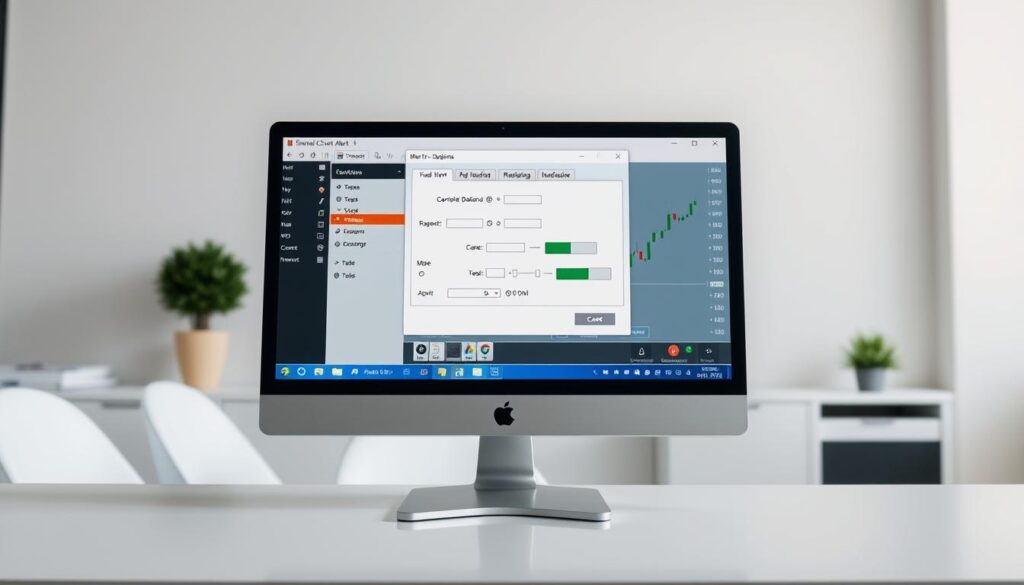
Initial settings use a 10-period average but adapt to different strategies. Access parameters by right-clicking the chart, selecting “Indicator List,” and choosing the tool. Adjust line colors, alert types, and calculation methods to match preferred analysis styles.
This configuration process takes under three minutes but significantly impacts signal accuracy. Regular updates ensure compatibility with MT4’s latest versions, maintaining consistent performance during volatile sessions.
Customizing Alert Settings for Trading Efficiency
Successful traders know timely information separates profit from missed chances. The system’s multi-layered notification framework keeps users informed without constant chart checks. Three core components work together to deliver updates across devices and platforms.
Enabling Terminal Alerts, Push Notifications, and Emails
The tool automatically activates all alert types upon installation. Traders can modify preferences through these steps:
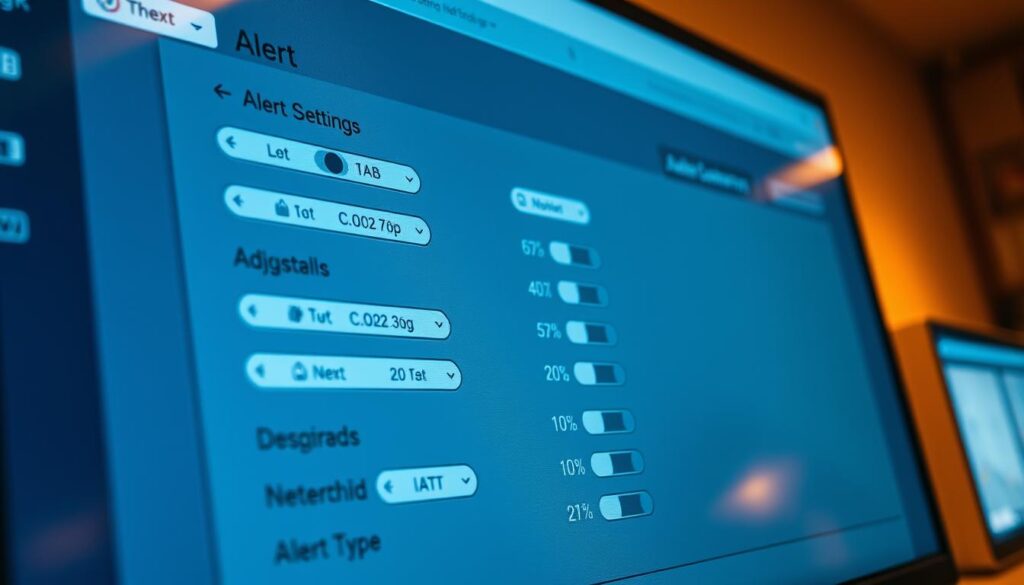
- Right-click the chart and select “Alert Settings” from the indicator menu
- Toggle checkboxes for platform pop-ups, mobile updates, or email summaries
- Set filters to trigger warnings only during specific sessions or price movements
Terminal alerts suit active traders watching multiple screens. Push notifications sync with mobile devices for market updates on the go. Email digests provide daily summaries for strategic planning.
Smart configuration prevents overload. Limit alerts to significant trend shifts or specific asset classes. This balance ensures responsiveness without distraction during volatile periods.
The automated system reduces emotional decision-making. Traders maintain discipline by acting only when validated signals arrive. This approach enhances consistency across various market conditions and time zones.
Interpreting SSL Channel Signals and the Flip Technique
Market participants seek reliable methods to decode price action, and the SSL Channel’s flip technique provides a systematic approach. This method tracks how prices interact with dual moving averages, creating visual cues for trend reversals or continuations. Traders quickly identify shifts in market momentum through color changes and line crossovers.
Identifying Bull and Bear Trend Reversals
A bullish signal emerges when prices break above the high SMA channel, turning the indicator green. Conversely, sustained movement below the low SMA triggers a red bearish alert. These transitions highlight shifts in market sentiment, separating genuine trend reversals from temporary retracements.
Understanding the Flip Technique Logic
The system compares current prices to two dynamic boundaries:
- High SMA: Acts as resistance during downtrends
- Low SMA: Serves as support in upward movements
When prices close outside these channels, the tool “flips” its calculation basis. This adjustment creates fresh buy sell signals while maintaining historical accuracy. Traders use these flips to confirm direction changes across time frames.
For example, a currency pair breaking above its 4-hour high SMA suggests momentum building. Combined with daily chart confirmations, this strengthens entry decisions. The method reduces guesswork by focusing on decisive price actions rather than minor fluctuations.
Using SSL Channel Chart Alert MT4 for Better Entry and Exit Signals
How do professionals pinpoint exact moments to enter or exit trades? The solution lies in mastering trading signals generated by dynamic technical tools. These systems filter market noise while highlighting high-probability setups across forex trading and other asset classes.
Optimal entry points emerge when price breaks through the indicator’s boundaries during consolidation phases. Traders confirm these signals by analyzing volume patterns or support/resistance levels. This approach works equally well for currency pairs and stock indices.
Exit strategies activate when the tool’s lines reconverge after sustained movements. Closing positions at these juncture points locks in profits before reversals occur. The alert indicator provides real-time notifications, ensuring timely reactions to changing conditions.
Different trading styles demand unique adaptations. Scalpers might use 5-minute charts with tighter thresholds, while swing traders prefer daily time frames. The system’s flexibility maintains accuracy across cryptocurrencies and commodities without requiring formula adjustments.
Integrating Additional Technical Indicators
Smart traders amplify their edge by combining technical tools for confirmation. Pairing the SSL system with complementary indicators creates layered signals that filter out market noise. This approach transforms isolated alerts into high-probability setups through strategic alignment.
Boosting Confidence Through Confluence
Three popular pairings enhance signal reliability:
- RSI identifies overextended markets when prices breach SSL boundaries
- ATR measures volatility to adjust stop-loss distances
- Volume oscillators confirm whether breakouts have trader participation
The Relative Strength Index works particularly well. When SSL lines flip during RSI extremes (below 30 or above 70), reversal chances increase. This dual confirmation helps traders avoid false breakouts during choppy sessions.
Average True Range values guide position sizing. Higher readings suggest wider price swings, prompting tighter stops. Combined with SSL signals, this creates adaptive risk management frameworks suited for dynamic markets.
Follow this 3-step process for effective combinations:
- Wait for primary SSL trend signals
- Check secondary tools for alignment
- Execute only when multiple indicators concur
This method prevents over-analysis paralysis. Traders maintain focus by setting clear entry rules, balancing thoroughness with decisive action. The result? Fewer trades but improved win rates across forex and commodity markets.
Adapting the Strategy Across Multiple Time Frames
Market success often hinges on aligning short-term actions with broader patterns. Traders achieve this by analyzing price movements across various intervals. Multi-timeframe analysis bridges tactical decisions with strategic direction, creating a cohesive approach to market navigation.
Top-Down Analysis for Consistent Trends
Begin by examining weekly or monthly charts to identify dominant trends. These higher intervals reveal where major support/resistance levels form. Once established, drill down to hourly or 15-minute charts for precise entries using the same indicators.
Longer time frames generate fewer but more reliable signals. Daily chart flips often indicate sustained momentum shifts. Conversely, 5-minute alerts help scalp quick opportunities without ignoring the bigger picture. This layered approach filters out market noise effectively.
Three rules prevent analysis paralysis:
- Prioritize signals aligning across at least two intervals
- Use 4-hour charts to confirm daily trend directions
- Set entry triggers only when shorter frames match longer-term bias
Conflicting signals between time frames suggest consolidation phases. Savvy traders either reduce position sizes or wait for clearer confirmations during these periods. The alert indicator becomes particularly useful here, notifying users when multiple intervals synchronize.
Adjust your strategy by testing different combinations. Pair weekly analysis with 30-minute entries for swing trades, or combine 4-hour trends with 5-minute triggers for day trading. Consistent profit patterns emerge when time frame hierarchies match your risk tolerance and schedule.
Managing Risk and Setting Stop Loss Levels
Risk management separates consistent traders from occasional gamblers. While technical tools provide valuable insights, lasting success demands disciplined protection of trading capital. Strategic stop placement acts as insurance against unpredictable market swings.
Techniques for Protecting Against False Signals
Price action confirmation reduces premature entries. Wait for candle closes beyond indicator boundaries before acting. This filters momentary spikes that often reverse quickly.
Volatility-based stops adapt to market conditions. Place orders 1.5 times the average true range beyond entry points. This breathing room prevents premature exits during normal fluctuations.
Partial position sizing limits exposure. Divide capital into smaller units, entering trades progressively as signals strengthen. Combine this with trailing stops that lock in profits as trends develop.
Traders should backtest strategies across various market phases. Historical performance during ranging versus trending conditions reveals a system’s true reliability. Adjust approach based on these insights rather than chasing every alert.


