ROC Indicator MT5: A Technical Analysis Tool Explained
Technical analysis tools help traders spot trends and make informed decisions. One such tool measures price momentum by calculating percentage changes over a selected period. This versatile oscillator simplifies trend identification and momentum shifts, making it popular among forex and stock traders.
When values cross key thresholds, the tool sends alerts through platforms like MetaTrader. These signals highlight potential entry or exit points, allowing users to act quickly during volatile conditions. Traders often combine it with other strategies to refine risk management and timing.
Unlike basic trend indicators, this approach focuses on relative price movements rather than absolute values. It works seamlessly across MetaTrader’s platforms, offering flexibility for both short-term and long-term analysis. Many find its zero-line crossovers particularly useful for confirming trend reversals.

This guide explores how the tool functions, its practical applications, and why it stands out among momentum-based strategies. Whether analyzing forex pairs or commodities, it provides a clear framework for interpreting market behavior.
Understanding the Rate of Change (ROC) Indicator
Momentum analysis provides traders with insights into how quickly prices shift over time. The rate change indicator measures this speed by comparing current and historical closing values. Its formula highlights percentage differences, offering a clear view of acceleration or slowdown in market movements.
How the Rate Change Formula Works
To calculate the rate change, subtract the closing price from N periods ago from the current price. Divide this difference by the older price, then multiply by 100. For example, if a currency pair closes at £1.20 today and £1.10 two weeks ago, the calculation would be (1.20 – 1.10)/1.10 * 100 = 9.09%.
Interpreting Momentum Shifts
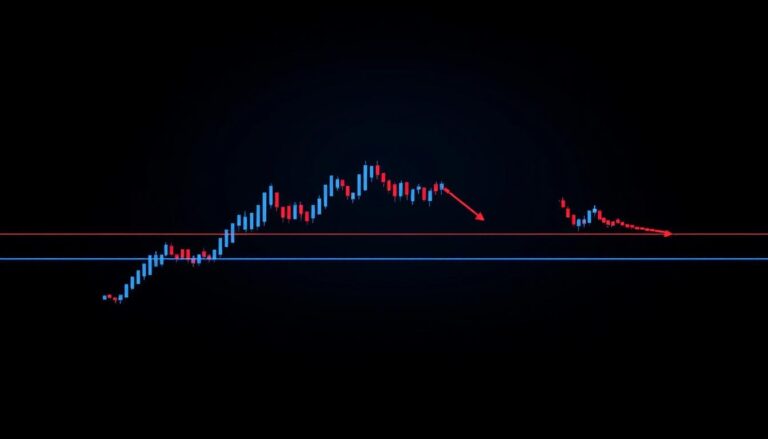
This tool acts as an oscillator, fluctuating above and below a zero line. Values above zero suggest upward momentum, while negative readings signal downward pressure. Traders watch for crossovers near this line—a move from negative to positive may hint at a bullish trend forming.
Sharp spikes often precede reversals, giving early warnings before price charts confirm the shift. Combining these signals with support/resistance levels improves accuracy. For instance, a rising rate change during a downtrend could indicate weakening selling pressure.
Implementing roc indicator mt5 in Your Trading Strategy

Timely alerts can mean the difference between capitalising on opportunities and missing critical market shifts. Traders often enhance their strategies by configuring automated notifications triggered by specific momentum thresholds. This approach ensures rapid responses without constant manual monitoring.
Setting Up ROC Alerts and Notifications
Start by downloading the alert indicator file from a trusted source. In MetaTrader, navigate to File > Open Data Folder. Copy the file into the MQL4/5 > Indicators directory. Refresh the platform by right-clicking the “Indicators” list and selecting “Refresh”.
Assign preferred notification channels under the indicator’s settings. Choose email, push alerts, or pop-up messages for zero-line crossovers. Arrows appear on charts when momentum shifts, simplifying visual confirmation. Customise sensitivity by adjusting the period length in the input parameters.
Integrating the Indicator with MT4 and MT5 Platforms
Both platforms support seamless integration, though installation paths differ slightly. For MT4 users, drag the file directly into the terminal window after placing it in the correct folder. MT5 requires compiling the file through the MetaEditor before activation.
Synchronising strategies across platforms allows traders to compare performance under varying market conditions. The indicator Metatrader compatibility ensures consistent signals, whether analysing forex pairs or indices. Alerts remain active even when charts are closed, safeguarding against missed triggers during downtime.
Decoding ROC Alerts, Divergences, and Trend Reversals

Divergences act as early warnings when price movements and momentum indicators disagree. These inconsistencies often precede significant market shifts, offering traders a chance to anticipate reversals or confirm trend strength. Monitoring these patterns helps refine entry and exit strategies.
Recognizing Regular and Hidden Divergences
A regular bullish divergence forms when prices make lower lows, but the momentum line creates higher lows. This signals weakening downward pressure. Conversely, a bearish divergence occurs during uptrends—prices reach higher highs while the oscillator fails to follow.
Hidden divergences confirm trend continuation. For example, if prices show a higher low during a pullback but the momentum line dips lower, it suggests buyers remain dominant. These setups often align with retracements in strong trends.
Crosses above or below the zero level add weight to signals. A move from negative to positive territory may confirm bullish momentum, especially when paired with divergences. Sharp spikes near these thresholds often highlight overbought or oversold conditions.
Traders combine these cues with chart patterns for higher accuracy. Arrows or colour shifts in alert systems simplify visual analysis. For instance, a hidden bullish divergence followed by a zero-line crossover could mark an optimal long entry in forex markets.
Practical Installation and Parameter Customization for ROC

Customising tools to fit trading strategies enhances precision in volatile markets. This section outlines how to install and fine-tune a momentum-based change indicator for MetaTrader 5. Proper setup ensures accurate tracking of price change patterns while aligning with individual risk preferences.
Step-by-Step Installation Guide
- Download the indicator archive from a verified source, ensuring compatibility with MT5.
- Open the platform and select File > Open Data Folder. Navigate to MQL5 > Indicators.
- Copy the unzipped files into this directory, then restart MT5 to activate the tool.
Adjust the period length under input parameters to reflect preferred timeframes. Shorter periods (e.g., 9-14 days) highlight recent price change volatility, while longer spans smooth out noise for trend analysis. Enable alerts for zero-line crossovers or extreme value thresholds to catch reversals early.
For seamless updates, avoid modifying original files—store custom settings in separate templates. If the tool doesn’t appear, right-click the indicators list and select “Refresh”. This resolves most installation hiccups without reinstalling.
Tailoring parameters sharpens signals for both continuation patterns and potential reversal zones. Pair shorter periods with moving averages to confirm breakouts, or extend calculations to validate long-term trends. Consistent testing across assets refines responsiveness to market shifts.
Final Thoughts on Mastering the ROC Indicator for Trading Success
Effective trading strategies rely on tools that adapt to market dynamics. The ROC’s strength lies in its ability to highlight momentum shifts through clear arrows and alert systems. These features simplify decision-making across forex and stock markets, letting traders spot opportunities without constant chart monitoring.
Pairing this tool with complementary strategies like RSI enhances accuracy. For example, combining oversold RSI readings with bullish ROC crossovers can validate entry points. Always test setups on MT4 demo accounts to refine sensitivity to price formations and level breaks.
Custom alert thresholds ensure timely responses to trend reversals. Set notifications for zero-line crosses or extreme momentum spikes to act swiftly. Regularly adjust parameters as market conditions evolve—shorter periods for volatile pairs, longer spans for stable assets.
Mastering this approach requires patience. Study historical charts to recognise how arrows align with support/resistance levels. With practice, traders can harness these signals to build adaptable, data-driven strategies in fast-paced trading environments.