Fibonacci Retracement Indicator: A Trading Guide
Many traders search for reliable methods to spot potential turning points in the market. One popular approach involves using tools based on mathematical principles. This guide explores a well-known technique used by technical analysts worldwide.
This specific tool helps identify key price areas during market pullbacks. It draws horizontal lines on a chart that act as potential support or resistance. Traders watch these zones closely for signs of a pause or reversal in the trend.
The concept finds its foundation in an ancient numerical sequence. By applying its ratios to modern price charts, it provides objective reference points. This helps market participants make more informed decisions.

This article will explain how to use this powerful method. Readers will learn to apply it across different market conditions. The goal is to help improve timing for entries and exits.
Introduction to Fibonacci Retracement Levels
Market participants frequently use percentage-based measurements to gauge price corrections. These tools help identify temporary pullbacks within larger price movements. The concept provides objective reference points for technical analysis.
Defining Retracement Levels for Traders
Retracement levels represent temporary price corrections within dominant trends. They measure how much a security’s price pulls back before continuing its original direction. Traders watch these percentage-based zones closely.
These mathematical levels act as potential support or resistance areas. Prices often pause or reverse at specific ratios like 38.2% or 61.8%. This occurs because many traders recognize and react to these same levels.
Relevance in Trending and Choppy Markets
The effectiveness of these tools depends heavily on market conditions. They perform best in clear trending environments where momentum is strong. Prices tend to respect the established levels more consistently.
In choppy or range-bound markets, the signals become less reliable. Without clear directional momentum, price action may ignore the traditional levels. Traders should adjust their strategies accordingly.
Understanding when these measurements work best helps traders make more informed decisions. It improves timing for entries and exits during different market phases.
Historical and Mathematical Foundations of Fibonacci Retracements

Long before modern trading platforms existed, ancient mathematicians uncovered a special numerical relationship that would later influence market analysis. This mathematical discovery traveled through civilizations over centuries.
Ancient Origins and the Fibonacci Sequence
The numerical pattern has roots in ancient Indian and Arabic mathematical traditions. Leonardo of Pisa, known as Fibonacci, introduced this concept to Europe in the 13th century.
His book Liber Abaci helped popularize the Hindu-Arabic numeral system. The sequence begins with zero and one, with each subsequent number being the sum of the two preceding ones.
This creates the famous series: 0, 1, 1, 2, 3, 5, 8, 13, 21, and so on. The pattern continues infinitely, creating a unique mathematical relationship.
The Golden Ratio and Its Significance in Trading
Dividing any number in the sequence by its predecessor yields approximately 1.618. This special value is known as the Golden Ratio or Phi.
The ratio appears throughout nature in flower petals, galaxy formations, and even human DNA. This widespread occurrence suggests an inherent natural order.
When applied to trading, these mathematical relationships create specific percentage levels. The 61.8%, 38.2%, and 23.6% levels come directly from this ancient sequence.
Traders use these percentages because they represent natural mathematical proportions. The deep historical roots give these levels credibility beyond arbitrary choices.
Using the Fibonacci Retracement Indicator
Technical analysis tools become most effective when used within the proper market context. Before applying any measurements, traders must first determine the market’s directional bias. This involves identifying whether prices are trending upward or downward.
Once the trend direction is established, the next step involves selecting appropriate reference points. These typically include the most recent significant high and low points on the chart. Modern trading platforms automate the calculation process after these points are identified.
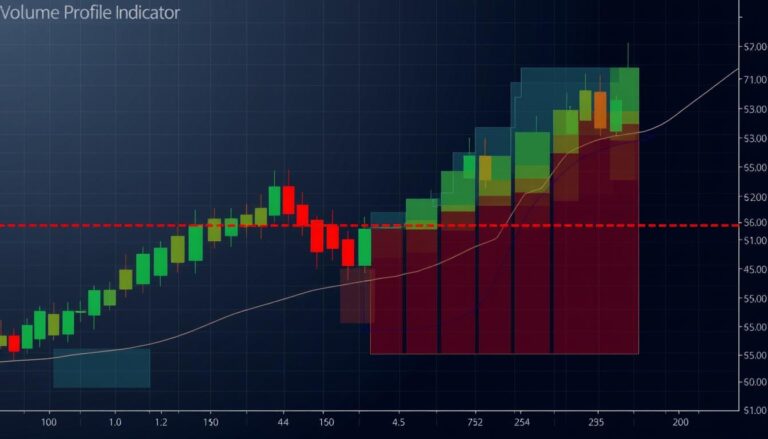
Key Fibonacci Retracement Percentages
The tool generates several important percentage levels that traders monitor closely. These include 23.6%, 38.2%, 50%, 61.8%, and 78.6% retracement zones. Each level represents a different magnitude of price correction.
Shallow pullbacks to the 23.6% or 38.2% areas often indicate strong underlying momentum. Deeper corrections reaching the 61.8% or 78.6% levels may signal potential trend weakness. The 50% mark, while not mathematically derived from the sequence, holds psychological significance.
These horizontal lines create visual zones where price action may pause or reverse. In upward trends, they act as potential support areas during pullbacks. During downward movements, the same levels serve as resistance zones.
Market participants use these percentages to plan entry points, set protective stops, and identify profit targets. The tool provides objective reference points that many traders watch simultaneously.
Applications in Technical Analysis and Trading Strategies

Professional traders rarely rely on a single tool for market analysis. They combine mathematical price levels with other technical approaches. This creates more reliable trading signals.
Using these levels alongside momentum oscillators improves decision-making. The RSI and MACD help confirm oversold or overbought conditions. Traders wait for multiple signals to align before entering positions.
Combining Levels with Other Indicators
Moving averages provide additional confirmation when they converge with key percentage zones. This creates higher-probability support or resistance areas. Multiple technical factors aligning increases trade conviction.
Candlestick patterns and volume analysis offer further validation. These elements help filter out low-probability setups. The approach becomes more structured and rule-based.
Integration with Elliot Wave Theory and Harmonic Patterns
Elliott Wave theory uses specific ratios to forecast market cycles. Wave 2 typically retraces 50% to 61.8% of Wave 1. Wave 4 commonly retraces 38.2% of Wave 3.
Harmonic patterns like the Gartley formation rely heavily on mathematical proportions. The pattern’s D-point reversal zone occurs at the 78.6% level. This provides clear entry points with defined risk parameters.
These integrations help traders identify high-probability reversal zones. They create a comprehensive framework for market analysis.
Step-by-Step Guide for Charting Fibonacci Retracement Levels

Setting up the tool correctly begins with identifying the right reference points on the chart. Traders must first locate the most recent significant swing high and swing low. These points represent where the price clearly reversed direction.
Identifying Swing Highs and Lows
A valid swing high occurs when price reaches a peak then reverses downward. A swing low forms when price hits a trough then reverses upward. Selecting significant points rather than minor fluctuations creates more reliable levels.
Calculating Retracement Percentages on Trading Platforms
Most trading software includes a built-in tool for this purpose. For an uptrend, click on the swing low first and drag to the swing high. The platform automatically plots horizontal lines at key percentages.
These include 23.6%, 38.2%, 50%, 61.8%, and 78.6% levels. The software calculates these based on the total price range between your selected points.
Real-Time Example and Practical Setup
Consider a move from 5,809 to 6,162.25 points. The range is 353.25 points. The 61.8% level calculates as 6,162.25 minus (0.618 × 353.25) = 5,944.00.
Traders watch for price action around these calculated levels. This provides objective entry and exit points that many market participants recognize simultaneously.
Risk Management and Considerations with Fibonacci Retracements

Even the most reliable technical tools carry inherent risks that traders must acknowledge. These mathematical levels provide valuable reference points but are not infallible predictors of market behavior.
The biggest challenge lies in the subjective selection of swing points. Different traders may choose varying highs and lows, creating conflicting retracement levels on the same chart.
Handling False Signals and Market Ambiguities
Prices sometimes briefly respect a level before breaking through it completely. This creates false signals that can trigger premature stop-loss orders.
These tools work best in trending markets with clear momentum. They become significantly less reliable during choppy or sideways market conditions.
Confirmation bias presents another risk. Traders might force levels to fit their preconceived ideas rather than objectively analyzing price action.
Practical risk management includes placing stops slightly beyond the next level rather than directly at it. This provides buffer room for normal price fluctuations.
The method’s effectiveness may partly stem from being a self-fulfilling prophecy. Since many watch these zones, concentrated buying or selling pressure naturally forms there.
Traders should always combine these levels with additional confirmation signals. Volume analysis, candlestick patterns, and other indicators help filter out low-probability setups.
Final Trading Perspectives on Using Fibonacci Retracements
Ultimately, this guide demonstrates that mathematical price levels are a powerful addition to a trader’s toolkit when applied with discipline. These levels provide a structured framework for identifying high-probability zones during market pullbacks.
Traders use these zones to plan entries, set protective stops, and identify profit targets. The approach works best in trending markets and across various time frames. However, it is most effective when combined with other forms of technical analysis.
Successful market participants view these levels as guidelines, not absolute rules. They seek confirmation from volume, candlestick patterns, or momentum indicators. This multi-layered analysis helps filter out false signals.
Mastering this tool requires practice in selecting valid swing points and patience to wait for price to reach key areas. Continuous learning and adaptation are essential for using it effectively in evolving market conditions.