Lucky Reversal Indicator: A Trader’s Guide to Market Reversals
Successful trading often hinges on spotting a change in direction. The Lucky Reversal Indicator is a tool designed to help with this exact challenge. It provides clear visual cues on price charts to signal potential trend changes.
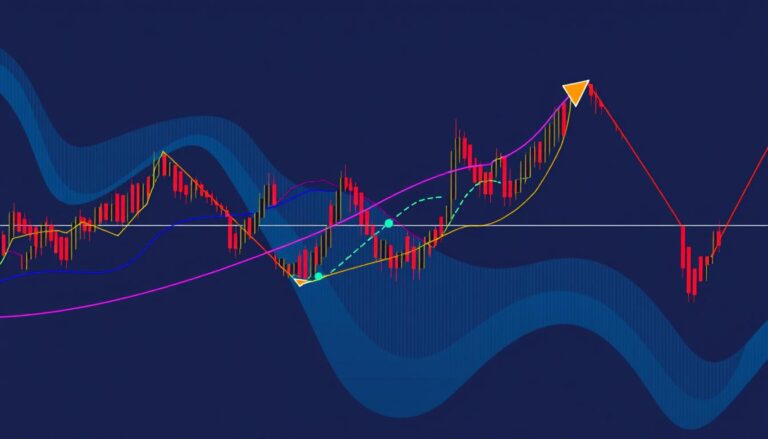
This tool simplifies complex market analysis. It displays arrows directly on the chart. A blue arrow suggests a possible upward move, while a red one points to a potential downward shift. This makes it accessible for traders at any level.
The primary goal is to filter out market noise. It helps traders distinguish between minor price fluctuations and genuine trend reversals. This can lead to more informed entry and exit decisions in the fast-paced forex market.

Using this tool encourages a more systematic approach. It reduces emotional reactions and supports disciplined trading. While powerful, it works best when combined with sound risk management and other analysis techniques.
Product Overview and Setup Strategy
Proper installation and parameter settings maximize the effectiveness of any trading system. This section covers the technical requirements for implementing the tool correctly.
Indicator Features and Platform Requirements
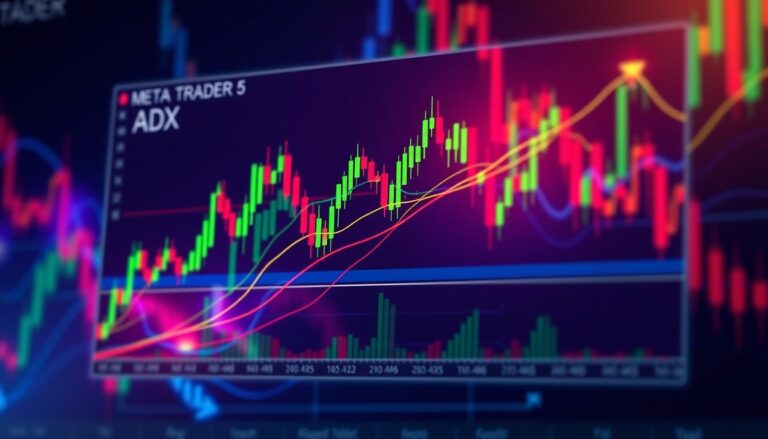
The system operates exclusively on the MetaTrader 4 platform. Traders need to download the file and place it in the MT4 indicators folder.
Community enhancements have added alert functionality to the original tool. This allows for real-time notifications when new signals appear.
Time Frames, Currency Pairs, and Moving Averages
The tool works best on 15, 30, and 60-minute charts. Each timeframe requires specific parameter settings for optimal performance.
Traders can use this system with any currency pairs in the forex market. It provides flexibility for various trading preferences.
The setup includes two exponential moving averages for confirmation. Both use close prices to validate trend direction alongside the main signals.
Mastering the Lucky Reversal Indicator

Mastering this system involves two key components: interpreting its color-coded signals and properly configuring platform settings. Traders need to develop skills in both areas to use the tool effectively.
Understanding Visual Arrows and Signal Colors
The system communicates through simple visual cues. Blue arrows suggest potential upward price movements. Red arrows indicate possible downward shifts in market direction.
These graphical markers appear at specific price levels where the algorithm detects trend changes. The color-coding provides immediate visual feedback for quick decision-making.
Traders should note that signals may sometimes repaint. This means arrows can shift or disappear after initial appearance. Waiting for candle close confirmation helps avoid false entries.
Integrating the Indicator with MT4 and its Parameters
Installation on MetaTrader 4 follows a straightforward process. Users copy the file to the platform’s indicators folder and restart the application.
Parameter settings allow customization for different trading styles. The period setting adjusts sensitivity – 60 for 15-minute charts and 240 for longer timeframes.
Community enhancements have added alert functionality. This feature provides audio notifications when new signals appear. It enables multi-chart monitoring without constant screen watching.
The tool works best when combined with other analysis methods. Proper integration creates a more reliable trading approach.
Technical Trading Strategies and Risk Management

A systematic approach to position management separates professional traders from amateurs. This section outlines specific rules for entering and exiting trades while managing potential losses.
Entry and Exit Rules for Long and Short Positions
Traders should wait for dual confirmation before entering positions. For a long trade, the system shows a blue arrow while EMA 14 crosses above EMA 20. Execute the buy order at candle close to avoid false signals.
Short positions follow similar confirmation rules. A red arrow appears alongside EMA 14 crossing below EMA 20. Enter the trade only after the confirming candle completes its formation.
Stop Loss, Profit Targets, and Trailing Stop Techniques
Risk management protects capital during volatile market conditions. Place stop losses below swing lows for long trades and above swing highs for short positions. Fixed stop distances vary by timeframe: 15-25 pips for M15, 25-40 for M30.
Three profit-taking methods offer flexibility. The 1:2 risk-reward ratio ensures profitability. Alternatively, exit when opposite signals appear. Trailing stops of 10-15 pips lock in gains during extended trends.
This multi-layered approach combines technical signals with disciplined risk controls. It creates a robust framework for forex market participation.
Final Insights and Next Steps
Mixed user feedback highlights the importance of personal verification for trading tools. The Lucky Reversal Indicator has received diverse reviews from the trading community, with some praising its performance while others note significant limitations.
A critical consideration is the tool’s repainting behavior, where historical signals may change after initial appearance. This characteristic means backtesting results might not accurately reflect live trading performance. Traders should approach this system with realistic expectations.
Beginning with demo account testing allows users to understand how the arrows appear and confirm with moving averages. This multi-signal approach helps filter false entries and increases the probability of identifying genuine trend changes in forex markets.
The tool is available for download, enabling immediate experimentation on MetaTrader 4. Regardless of signal quality, proper risk management remains essential for sustainable trading success. Documenting results and refining strategies based on personal performance data represents the logical next step.