Mastering the Moving Average Crossover Indicator
Trading experts see the Moving Average Crossover indicator as a key tool. It helps spot market trends and trading chances by watching moving averages meet.
This tool lets traders understand price changes well. It tracks different moving averages to find market shifts. This helps traders know when to buy or sell.
Traders use this strategy in many markets like stocks, forex, and crypto. It’s good for quick trades or long-term plans. It helps see market trends clearly.

Financial experts like it for cutting through market noise. It shows price trends clearly. Traders use it with other tools to improve their plans and lower risks.
Getting good at the Moving Average Crossover takes practice. Traders need to read crossover signals right. They also need to use it with deep market analysis to do well.
What is the Moving Average Crossover Indicator?
https://www.youtube.com/watch?v=AUEIEzCDZvw&pp=ugMICgJrbxABGAE%3D
The Moving Average Crossover indicator is a key tool for traders. It helps them understand market trends. By watching how different moving averages cross over, traders find important insights.
Definition and Basics
The MA crossover strategy looks at two moving averages. It uses short-term and long-term averages to spot trend changes. This helps traders know when to buy or sell.
- Short-term traders often use 5-day and 20-day moving averages
- Long-term investors frequently rely on 50-day and 200-day moving averages
- The crossover point signals possible trend reversals
Importance in Trading
The Moving Average strategy helps traders understand markets better. It lets them:
- Spot trend changes
- Get buy and sell signals
- Manage risk better
- Stay away from emotional trading
Important signs like the Golden Cross and the Death Cross give clues about market mood. They help predict future price moves.
Types of Moving Averages Explained
Traders use two main types of moving averages to understand market trends. These tools help investors make better trading choices.
Simple Moving Average (SMA)
The Simple Moving Average (SMA) is a key tool in trading. It finds the average closing prices over a set time. This is done by adding prices and dividing by the number of periods.
- Calculates equal weight for all price points
- Smooths out price fluctuations
- Typically used for longer-term trend analysis
Traders use SMA to track trends over different times. For example, they might look at 10-day, 50-day, and 200-day SMAs. The 200-day SMA shows long-term market trends.
Exponential Moving Average (EMA)
The Exponential Moving Average (EMA) is more responsive to market changes. It gives more weight to recent prices, making it quicker to react to market shifts.
- Emphasizes recent price movements
- Reacts faster to price changes
- Preferred by short-term traders
EMA uses a formula that focuses on recent prices. This can give traders quicker signals. Many traders mix SMA and EMA for stronger strategies.
How to Calculate Moving Averages
The Moving Average indicator is a key tool in technical analysis. It helps traders see price trends. To use it, you need to know how to calculate moving averages.
There are two main ways to calculate moving averages. These are Simple Moving Average (SMA) and Exponential Moving Average (EMA). Each method gives different insights into market trends.
Simple Moving Average (SMA) Calculation
The SMA is easy to use for tracking price trends. Here’s how to do it:
- Sum the closing prices for a specific number of periods
- Divide the total by the number of periods
- Example: A 5-day SMA would add the closing prices of five days and divide by 5
Exponential Moving Average (EMA) Calculation
The EMA is more complex. It gives more weight to recent prices. Its formula is:
- Calculate the smoothing factor: 2 / (number of periods + 1)
- Use a weighting multiplier that emphasizes recent prices
- Incorporate the current price and previous EMA
Traders often use standard periods for moving averages. These are 10 days for short-term, 50 days for mid-term, and 200 days for long-term. Knowing these calculations can improve your trading strategy.
Understanding the Crossover Signal

The Moving Average Crossover indicator is a key tool for traders. It helps spot trend changes in markets. By looking at short and long moving averages, traders get MA crossover signals. These signals give important market insights.
- Bullish Crossover
- Bearish Crossover
Bullish Crossover Explained
A bullish crossover happens when a short-term moving average goes above a long-term one. This means prices might go up. It shows more people are buying.
What makes a bullish crossover special is:
- Shorter moving average (like the 9-day EMA) goes above the longer one (like the 21-day EMA)
- It’s a good time to buy
- It might mean the trend is switching from down to up
Bearish Crossover Dynamics
A bearish crossover is when a short-term moving average goes below a long-term one. This could mean prices are going down. It’s a sign to think about selling or shorting.
Important things about a bearish crossover are:
- Shorter moving average (like the 9-day EMA) falls below the longer one (like the 21-day EMA)
- It’s a good time to sell or short
- It might mean the trend is switching from up to down
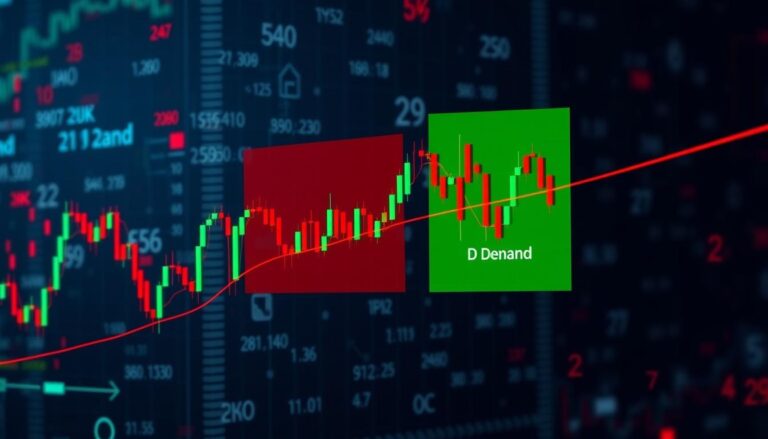
Identifying Key Trends with Crossovers

Traders use moving average crossover strategies to understand market trends. This strategy helps spot both short-term and long-term market movements.
Identifying trends needs a detailed look at moving averages. Traders use different time frames and moving averages to find important market signals.
Short-Term vs. Long-Term Trend Analysis
The Moving Average strategy helps tell short-term from long-term trends. It does this by analyzing different moving average periods:
- Short-term trends: Uses 9 and 21-period moving averages
- Long-term trends: Looks at 50 and 200-period moving averages
- Critical confirmation signals emerge when multiple moving averages align
Trend Confirmation Techniques
Advanced traders use special techniques to check trend signals. Key methods include:
- Looking at how multiple moving averages relate to each other
- Checking trend strength by seeing when moving averages cross
- Seeing where prices are compared to moving averages
For example, a strong bullish trend might be: 8 EMA > 21 EMA > 50 EMA. A bearish trend might show 8 EMA
Common Strategies Using the Indicator

Traders use MA crossover trading to improve their market analysis. The Moving Average crossover method helps find trading opportunities. It offers different ways to spot these chances.
Professional traders mix Moving Average crossover signals with other indicators. This makes their trades more accurate. Some key strategies are:
- Multi-period Moving Average Momentum Strategy
- Crossover signals with momentum oscillators
- Risk management techniques
Crossover with Other Indicators
Good MA crossover trading also uses other tools. Traders often combine it with:
- Relative Strength Index (RSI)
- Moving Average Convergence Divergence (MACD)
- Stochastic Oscillator
Multiple Time Frame Analysis
Advanced traders use the Moving Average crossover method on different time frames. They look at crossovers on daily, weekly, and monthly charts. This helps build a strong trading strategy.
Important things for multiple time frame analysis are:
- Confirming trend direction
- Finding entry and exit points
- Lowering false signal risks
By using these advanced MA crossover trading methods, traders can create better and more profitable strategies.
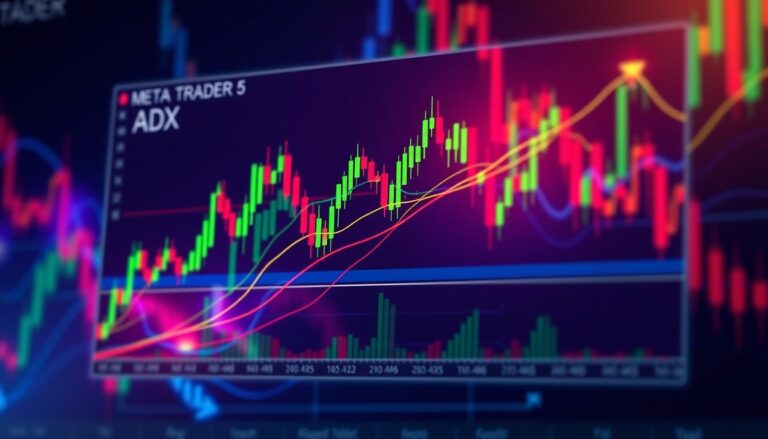
Setting Up the Moving Average Crossover in Trading Platforms

Setting up a Moving Average indicator in trading platforms needs careful steps. Traders use many popular platforms for their MA crossover strategy.
Trading platforms have great tools for setting up Moving Average indicators. Traders can pick from top platforms for advanced technical analysis:
- MetaTrader 4/5
- TradingView
- ThinkOrSwim
- Interactive Brokers
- NinjaTrader
Platform Setup Basics
To use a Moving Average indicator, follow these basic steps:
- Open the trading platform’s chart interface
- Find the indicator menu or toolbox
- Pick Moving Average from the indicators
- Choose between Simple Moving Average (SMA) or Exponential Moving Average (EMA)
- Set the period (common ones: 9, 21, 50, 200)
Configuration Strategies
When setting up the MA crossover strategy, think about different moving average periods. Short-term traders use 5-day and 20-day averages. Long-term investors prefer 50-day and 200-day averages.
Most platforms let you customize settings. You can change colors, line styles, and add multiple moving averages. This helps identify trends and implement strategies.
Advantages of Using the Moving Average Crossover
Traders often choose the Moving Average Crossover indicator for its power and simplicity. It’s great for both new and seasoned traders.
The MA crossover strategy helps traders in complex markets. It shows its strengths clearly. This helps investors make better trading choices.
Risk Management Benefits
Risk management is key to trading success. The Moving Average Crossover indicator helps in several ways:
- It gives clear entry and exit signals
- It spots trend reversals fast
- It lets you set exact stop-loss points
- It cuts down on emotional trading
Simplicity and Effectiveness
The Moving Average Crossover indicator is very simple. It works well in many markets, like stocks, forex, and cryptocurrencies.
- It’s easy to use and understand
- It works in different time frames
- It’s good with various moving averages
- It gives strong trend confirmation signals
The MA crossover strategy is effective because it shows important market trends. It helps traders see price movements and market feelings by watching moving averages.
Limitations to Be Aware Of
Trading with Moving Average strategy has its challenges. MA crossover signals offer insights, but there are drawbacks. These can affect your investment choices.
The Lagging Nature of Moving Averages
Moving averages look back at past price movements. This means signals come after market changes. This lag is a big challenge in fast markets.
- Delayed trend recognition
- Potential missed trading opportunities
- Risk of entering positions too late
False Signals and Market Volatility
MA crossover signals can be misleading, mainly in choppy markets. Traders might see many crossovers that don’t show real trend changes.
- Increased risk of unnecessary trades
- Potential for higher transaction costs
- Reduced trading strategy effectiveness
Experienced traders suggest combining Moving Average strategy with other indicators. This helps reduce these issues and boosts trading accuracy.
Real-World Examples and Case Studies
Looking at real-world uses of the Moving Average crossover method helps traders. It shows how to spot market trends and when to buy or sell. MA crossover trading is a strong way to find these opportunities.
Now, let’s look at some examples that show how well the Moving Average crossover method works:
Successful Trade Examples
- In a recent S&P 500 market analysis, traders found a Golden Cross. This happened when the 50-day moving average went above the 200-day. It showed a possible good trend.
- Nasdaq traders used the RSI with moving averages to spot when prices were too high. This helped them make better trading choices.
- Technical analysts saw big trend changes by mixing moving average crossovers with other tools like MACD.
Analyzing Past Market Trends
MA crossover trading gives special insights into market movements. Traders have used moving averages to:
- Spot when trends might change
- Show market strength with different indicators
- Set smart stop-loss and take-profit levels
A case study showed that long positions with the 50-day moving average did better than short ones. This shows the strength of using moving averages wisely in trading.
But, remember, moving averages are just tools. They work best with deep market analysis and careful risk management.
Tips for Mastering the Indicator
Getting good at the Moving Average indicator takes practice and learning. Traders need to spend time learning how it works in different market situations. Starting with demo accounts is a key step to build skills without losing money.
Practicing with Demo Accounts
Traders can improve by trying out different settings in safe places. Demo accounts let them test various moving average periods and crossover setups. This helps them understand the market better without losing money.
Continuous Learning and Adaptation
Using the MA crossover strategy well means always learning and being open to change. Markets change fast, so traders must keep learning and testing new ideas. Using the Moving Average indicator with other tools can make trading decisions better.
Experts say to always keep learning, track how you’re doing, and be ready to change. By always improving and keeping up with new tools and ideas, traders can make their investment strategies work better.